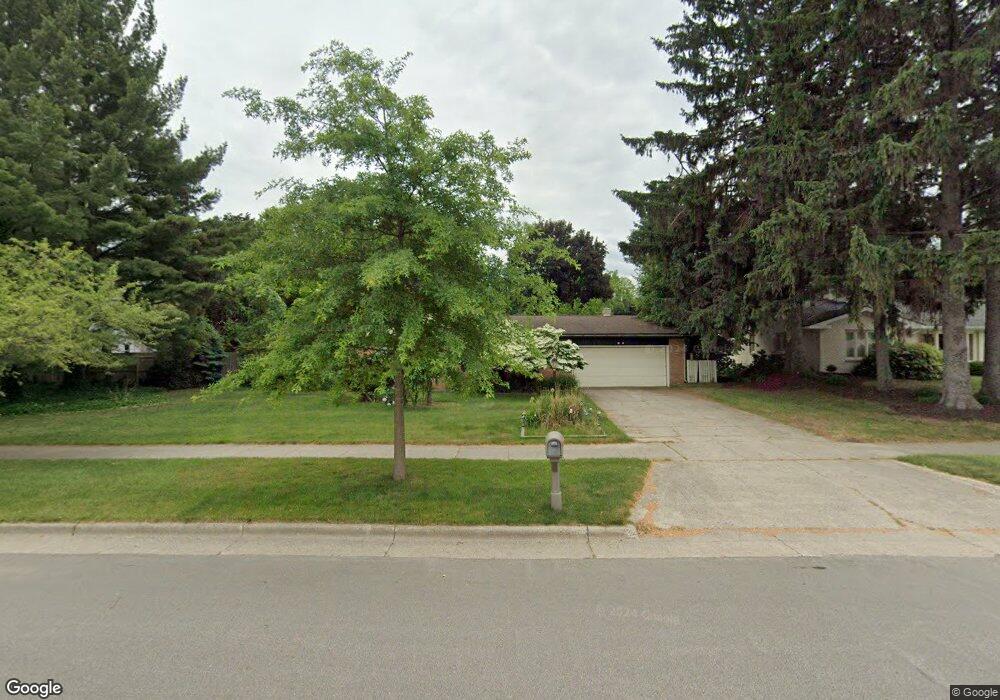
12 W 38th St Holland, MI 49423
Maplewood NeighborhoodEstimated Value: $394,000 - $412,000
4
Beds
2
Baths
1,882
Sq Ft
$215/Sq Ft
Est. Value
About This Home
This home is located at 12 W 38th St, Holland, MI 49423 and is currently estimated at $403,705, approximately $214 per square foot. 12 W 38th St is a home located in Allegan County with nearby schools including Jefferson Elementary School, Holland High School, and Black River Public School.
Ownership History
Date
Name
Owned For
Owner Type
Purchase Details
Closed on
Oct 1, 2019
Sold by
Mcandrew William S
Bought by
Mcandrew William Steven and William Steven Mcandrew Living
Current Estimated Value
Purchase Details
Closed on
Jun 8, 2001
Sold by
Sprik Lyle J and Sprik Ellen C
Bought by
Gettings Michael and Gettings Sharon
Home Financials for this Owner
Home Financials are based on the most recent Mortgage that was taken out on this home.
Original Mortgage
$120,000
Outstanding Balance
$45,777
Interest Rate
7.16%
Estimated Equity
$357,928
Create a Home Valuation Report for This Property
The Home Valuation Report is an in-depth analysis detailing your home's value as well as a comparison with similar homes in the area
Home Values in the Area
Average Home Value in this Area
Purchase History
| Date | Buyer | Sale Price | Title Company |
|---|---|---|---|
| Mcandrew William Steven | -- | None Available | |
| Gettings Michael | $155,000 | Metropolitan Title Company |
Source: Public Records
Mortgage History
| Date | Status | Borrower | Loan Amount |
|---|---|---|---|
| Open | Gettings Michael | $120,000 |
Source: Public Records
Tax History Compared to Growth
Tax History
| Year | Tax Paid | Tax Assessment Tax Assessment Total Assessment is a certain percentage of the fair market value that is determined by local assessors to be the total taxable value of land and additions on the property. | Land | Improvement |
|---|---|---|---|---|
| 2025 | $3,228 | $191,900 | $36,300 | $155,600 |
| 2024 | -- | $159,000 | $32,000 | $127,000 |
| 2023 | $3,001 | $142,700 | $26,700 | $116,000 |
| 2022 | $2,865 | $130,400 | $25,600 | $104,800 |
| 2021 | $2,744 | $111,200 | $24,600 | $86,600 |
| 2020 | $2,732 | $103,800 | $19,600 | $84,200 |
| 2019 | $2,600 | $93,100 | $15,400 | $77,700 |
| 2018 | $2,600 | $86,400 | $15,400 | $71,000 |
| 2017 | $0 | $70,200 | $8,200 | $62,000 |
| 2016 | $0 | $70,200 | $8,200 | $62,000 |
| 2015 | -- | $70,200 | $8,200 | $62,000 |
| 2014 | -- | $60,800 | $8,200 | $52,600 |
| 2013 | -- | $57,000 | $8,200 | $48,800 |
Source: Public Records
Map
Nearby Homes
- 91 W 40th St
- 81 E 40th St
- 817 Central Ave
- 94 Old Mill Dr Unit 16
- 171 E 37th St
- 149 W 32nd St
- 106 E 31st St
- 135 W 31st St
- 202 E 34th St
- 155 W 31st St
- 199 E 34th St Unit 10
- 834 Millbridge Ave Unit 56
- 860 York Ave
- 1112 Fountain View Cir
- 970 Sagewood Ct Unit 4
- 13 W 26th St
- 648 Columbia Ave
- 195 E 28th St
- 1084 Fountain View Cir Unit 4
- 935 Chelsea Ct