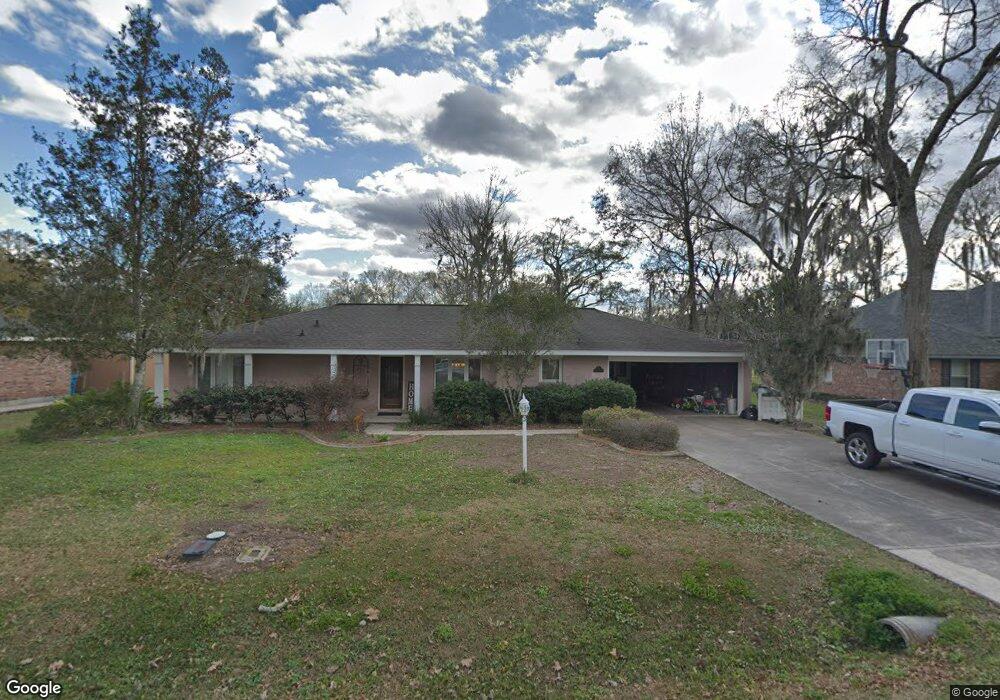
12 W Levert Dr Luling, LA 70070
Estimated Value: $288,501 - $356,000
Studio
--
Bath
2,567
Sq Ft
$128/Sq Ft
Est. Value
About This Home
This home is located at 12 W Levert Dr, Luling, LA 70070 and is currently estimated at $328,625, approximately $128 per square foot. 12 W Levert Dr is a home located in St. Charles Parish with nearby schools including Mimosa Park Elementary School, Lakewood Elementary School, and J.B. Martin Middle School.
Ownership History
Date
Name
Owned For
Owner Type
Purchase Details
Closed on
Jul 31, 2007
Sold by
Staci Prince Johnson Trust
Bought by
Folse Elizabeth Zabritski and Folse Brian Michael
Current Estimated Value
Home Financials for this Owner
Home Financials are based on the most recent Mortgage that was taken out on this home.
Original Mortgage
$213,750
Outstanding Balance
$132,049
Interest Rate
6.64%
Mortgage Type
New Conventional
Estimated Equity
$196,576
Create a Home Valuation Report for This Property
The Home Valuation Report is an in-depth analysis detailing your home's value as well as a comparison with similar homes in the area
Home Values in the Area
Average Home Value in this Area
Purchase History
| Date | Buyer | Sale Price | Title Company |
|---|---|---|---|
| Folse Elizabeth Zabritski | $225,000 | None Available |
Source: Public Records
Mortgage History
| Date | Status | Borrower | Loan Amount |
|---|---|---|---|
| Open | Folse Elizabeth Zabritski | $213,750 |
Source: Public Records
Tax History
| Year | Tax Paid | Tax Assessment Tax Assessment Total Assessment is a certain percentage of the fair market value that is determined by local assessors to be the total taxable value of land and additions on the property. | Land | Improvement |
|---|---|---|---|---|
| 2025 | $1,776 | $25,070 | $9,320 | $15,750 |
| 2024 | $1,776 | $25,070 | $9,320 | $15,750 |
| 2023 | $1,803 | $21,807 | $5,920 | $15,887 |
| 2022 | $2,550 | $21,807 | $5,920 | $15,887 |
| 2021 | $2,315 | $19,626 | $5,328 | $14,298 |
| 2020 | $2,576 | $21,807 | $5,920 | $15,887 |
| 2019 | $2,586 | $21,807 | $4,700 | $17,107 |
| 2018 | $2,566 | $21,807 | $4,700 | $17,107 |
| 2017 | $2,563 | $21,807 | $4,700 | $17,107 |
| 2016 | $2,574 | $21,807 | $4,700 | $17,107 |
| 2015 | $1,499 | $20,250 | $3,975 | $16,275 |
| 2014 | $1,444 | $20,250 | $3,975 | $16,275 |
| 2013 | $1,450 | $20,250 | $3,975 | $16,275 |
Source: Public Records
Map
Nearby Homes
Your Personal Tour Guide
Ask me questions while you tour the home.