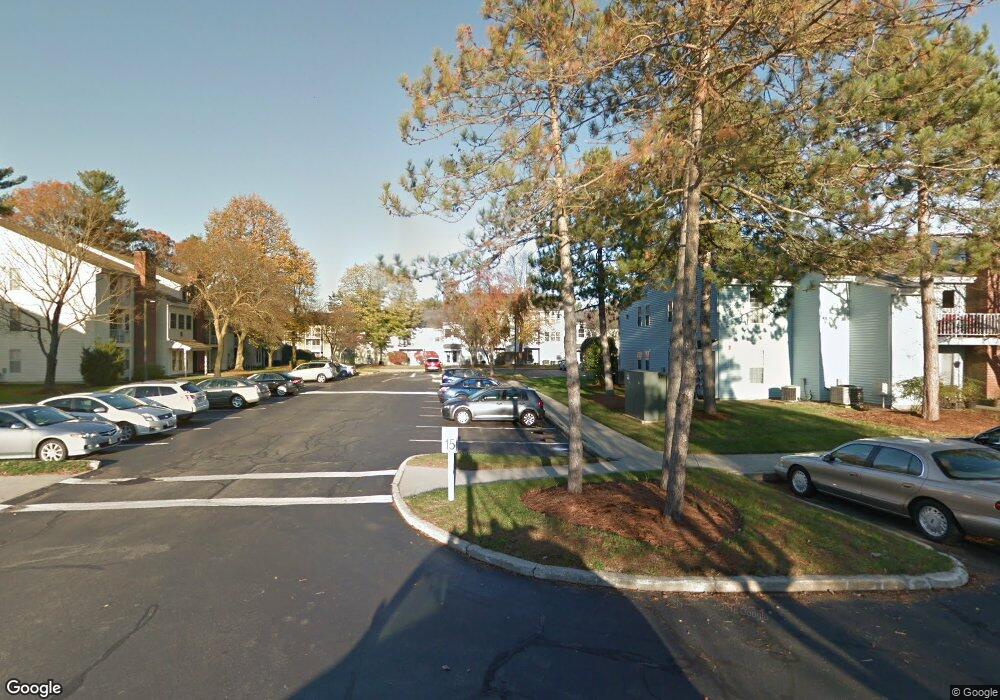
12 Walden Dr Natick, MA 01760
Estimated Value: $300,000 - $431,000
1
Bed
1
Bath
600
Sq Ft
$577/Sq Ft
Est. Value
About This Home
This home is located at 12 Walden Dr, Natick, MA 01760 and is currently estimated at $345,957, approximately $576 per square foot. 12 Walden Dr is a home located in Middlesex County with nearby schools including Natick High School, J F Kennedy Middle School, and Brown Elementary School.
Ownership History
Date
Name
Owned For
Owner Type
Purchase Details
Closed on
Oct 30, 2025
Sold by
Dangi Nikhil and Dangi Ritu
Bought by
Dobay Blake D
Current Estimated Value
Home Financials for this Owner
Home Financials are based on the most recent Mortgage that was taken out on this home.
Original Mortgage
$284,050
Outstanding Balance
$284,050
Interest Rate
6.26%
Mortgage Type
Purchase Money Mortgage
Estimated Equity
$61,907
Purchase Details
Closed on
Apr 4, 2019
Sold by
96 Walden Drive T and Healy
Bought by
Kumar Ritu and Kumar Nikhil
Home Financials for this Owner
Home Financials are based on the most recent Mortgage that was taken out on this home.
Original Mortgage
$163,500
Interest Rate
4.3%
Mortgage Type
New Conventional
Purchase Details
Closed on
Jul 9, 1987
Sold by
Star Trust
Bought by
Natick V Trust
Create a Home Valuation Report for This Property
The Home Valuation Report is an in-depth analysis detailing your home's value as well as a comparison with similar homes in the area
Home Values in the Area
Average Home Value in this Area
Purchase History
| Date | Buyer | Sale Price | Title Company |
|---|---|---|---|
| Dobay Blake D | $299,000 | -- | |
| Kumar Ritu | $218,000 | -- | |
| Natick V Trust | $98,900 | -- |
Source: Public Records
Mortgage History
| Date | Status | Borrower | Loan Amount |
|---|---|---|---|
| Open | Dobay Blake D | $284,050 | |
| Previous Owner | Kumar Ritu | $163,500 | |
| Previous Owner | Natick V Trust | $3,440 | |
| Previous Owner | Natick V Trust | $50,400 |
Source: Public Records
Tax History Compared to Growth
Tax History
| Year | Tax Paid | Tax Assessment Tax Assessment Total Assessment is a certain percentage of the fair market value that is determined by local assessors to be the total taxable value of land and additions on the property. | Land | Improvement |
|---|---|---|---|---|
| 2025 | $3,483 | $291,200 | $0 | $291,200 |
| 2024 | $3,101 | $252,900 | $0 | $252,900 |
| 2023 | $3,046 | $241,000 | $0 | $241,000 |
| 2022 | $3,062 | $229,500 | $0 | $229,500 |
| 2021 | $2,998 | $220,300 | $0 | $220,300 |
| 2020 | $2,930 | $215,300 | $0 | $215,300 |
| 2019 | $2,608 | $205,200 | $0 | $205,200 |
| 2018 | $2,341 | $179,400 | $0 | $179,400 |
| 2017 | $2,176 | $161,300 | $0 | $161,300 |
| 2016 | $2,137 | $157,500 | $0 | $157,500 |
| 2015 | $1,831 | $132,500 | $0 | $132,500 |
Source: Public Records
Map
Nearby Homes
- 12 Walden Dr Unit 19
- 9 Silver Hill Ln Unit 19
- 26 Walden Dr Unit 4
- 46 Silver Hill Ln Unit 1
- 32 Silver Hill Ln Unit 1
- 40 Silver Hill Ln Unit 4
- 57 Village Brook Ln Unit 5
- 50 Village Brook Ln Unit 4
- 51 Village Brook Ln Unit 16
- 4 Sylvia Ave
- 6 Village Rock Ln Unit 17
- 5 Village Rock Ln Unit 24
- 7 Orchard View Cir Unit 7
- 91 Speen St
- 1 Glen St Unit B
- 38 Ranger Rd
- 2 Lodge Rd
- 10 Kelsey Rd
- 150 2nd St Unit 310
- 26 Willis St Unit 33
- 12 Walden Dr Unit 20
- 12 Walden Dr Unit 18
- 12 Walden Dr Unit 17
- 12 Walden Dr Unit 16
- 12 Walden Dr Unit 15
- 12 Walden Dr Unit 14
- 12 Walden Dr Unit 13
- 12 Walden Dr Unit 11
- 12 Walden Dr Unit 17,12
- 12 Walden Dr Unit 14,12
- 5 Post Oak Ln Unit 24
- 5 Post Oak Ln Unit 23
- 5 Post Oak Ln Unit 22
- 5 Post Oak Ln Unit 21
- 5 Post Oak Ln Unit 20
- 5 Post Oak Ln Unit 19
- 5 Post Oak Ln Unit 18
- 5 Post Oak Ln Unit 17
- 5 Post Oak Ln Unit 16
- 5 Post Oak Ln Unit 15