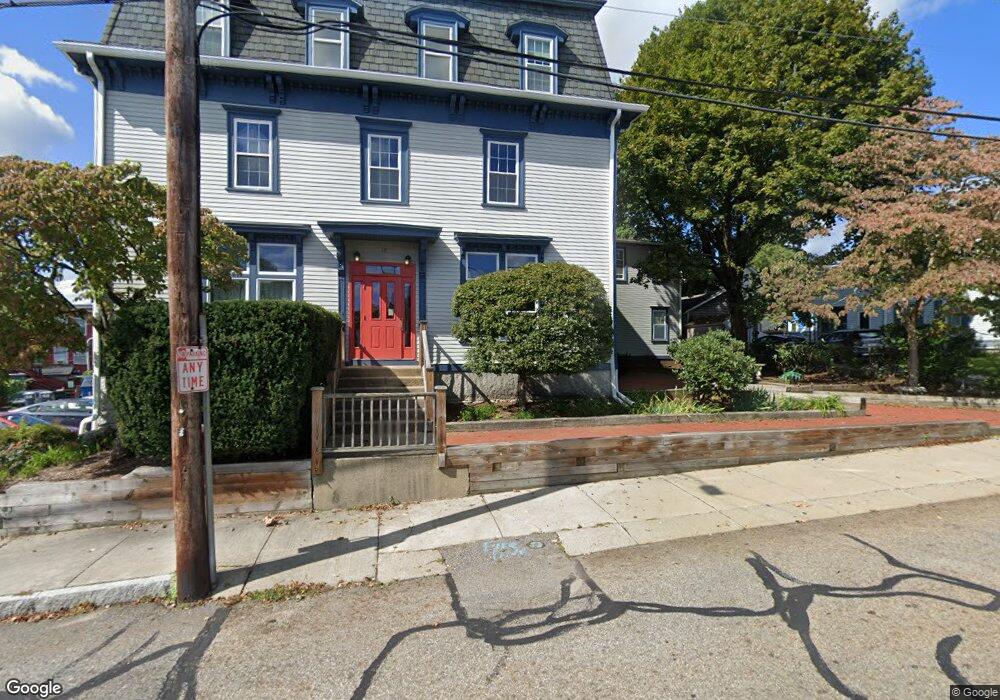
12 Walnut St Unit 21 Natick, MA 01760
Estimated Value: $683,392
Studio
--
Bath
900
Sq Ft
$759/Sq Ft
Est. Value
About This Home
This home is located at 12 Walnut St Unit 21, Natick, MA 01760 and is currently estimated at $683,392, approximately $759 per square foot. 12 Walnut St Unit 21 is a home located in Middlesex County with nearby schools including Natick High School, Lilja Elementary School, and Wilson Middle School.
Ownership History
Date
Name
Owned For
Owner Type
Purchase Details
Closed on
May 6, 2005
Sold by
Grupposo Doreen A and Grupposo Mark L
Bought by
Phillips Kenneth B
Current Estimated Value
Home Financials for this Owner
Home Financials are based on the most recent Mortgage that was taken out on this home.
Original Mortgage
$200,000
Outstanding Balance
$104,070
Interest Rate
6.01%
Mortgage Type
Commercial
Estimated Equity
$579,322
Purchase Details
Closed on
Dec 29, 1998
Sold by
Adprop Lp
Bought by
Grupposo Mark L and Grupposo Doreen A
Home Financials for this Owner
Home Financials are based on the most recent Mortgage that was taken out on this home.
Original Mortgage
$187,500
Interest Rate
6.89%
Mortgage Type
Commercial
Purchase Details
Closed on
Sep 3, 1992
Sold by
Fitzpatrick William T
Bought by
Fitzpatrick William T and Adprop Lp
Create a Home Valuation Report for This Property
The Home Valuation Report is an in-depth analysis detailing your home's value as well as a comparison with similar homes in the area
Home Values in the Area
Average Home Value in this Area
Purchase History
| Date | Buyer | Sale Price | Title Company |
|---|---|---|---|
| Phillips Kenneth B | $350,000 | -- | |
| Grupposo Mark L | $250,000 | -- | |
| Fitzpatrick William T | $350,000 | -- |
Source: Public Records
Mortgage History
| Date | Status | Borrower | Loan Amount |
|---|---|---|---|
| Open | Phillips Kenneth B | $200,000 | |
| Previous Owner | Fitzpatrick William T | $187,500 | |
| Closed | Fitzpatrick William T | $37,500 |
Source: Public Records
Tax History
| Year | Tax Paid | Tax Assessment Tax Assessment Total Assessment is a certain percentage of the fair market value that is determined by local assessors to be the total taxable value of land and additions on the property. | Land | Improvement |
|---|---|---|---|---|
| 2025 | $5,296 | $442,800 | $0 | $442,800 |
| 2024 | $5,429 | $442,800 | $0 | $442,800 |
| 2023 | $5,597 | $442,800 | $0 | $442,800 |
| 2022 | $5,907 | $442,800 | $0 | $442,800 |
| 2021 | $6,154 | $452,200 | $0 | $452,200 |
| 2020 | $6,154 | $452,200 | $0 | $452,200 |
| 2019 | $5,747 | $452,200 | $0 | $452,200 |
| 2018 | $5,563 | $426,300 | $0 | $426,300 |
| 2017 | $5,751 | $426,300 | $0 | $426,300 |
| 2016 | $5,748 | $423,600 | $0 | $423,600 |
| 2015 | $5,469 | $395,700 | $0 | $395,700 |
Source: Public Records
Map
Nearby Homes
- 49 Summer St
- 16 Harvard St
- 20 Florence St Unit B
- 17 Florence St
- 4B Lincoln St Unit 4B
- 3 Wilson St Unit 3B
- 6A Lincoln St Unit 6A
- 3A Wilson St Unit 3A
- 36 Winnemay St
- 9 Bellevue Rd
- 63 Pond St
- 67 E Central St & 5 Union St
- 3 Vale St Unit A
- 11 Avon St
- 53 Harvard Street Extension
- 12 Floral Ave
- 6 Floral Avenue Extension
- 5 Reynolds Ave Unit 2
- 41 Charles St
- 142 Bacon St
- 12 Walnut St Unit 20
- 12 Walnut St Unit 18
- 12 Walnut St Unit 17
- 12 Walnut St Unit 16
- 12 Walnut St Unit 15
- 12 Walnut St Unit 14
- 12 Walnut St Unit 13
- 12 Walnut St
- 12 Walnut St Unit 11
- 12 Walnut St Unit 10
- 12 Walnut St Unit 9
- 12 Walnut St Unit 8
- 12 Walnut St Unit 7
- 12 Walnut St Unit 6
- 12 Walnut St Unit 5
- 12 Walnut St Unit 3
- 12 Walnut St Unit 2
- 12 Walnut St Unit 1
- 12 Walnut St Unit 17,12
- 12 Walnut St Unit 10,12
Your Personal Tour Guide
Ask me questions while you tour the home.