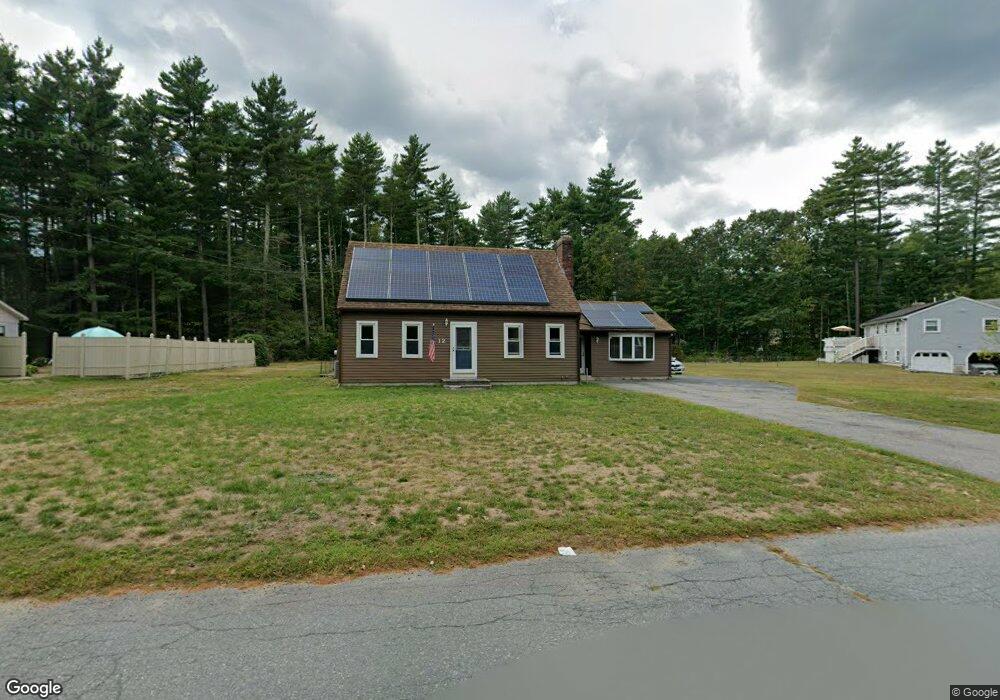
12 Walnut St Townsend, MA 01469
Estimated Value: $484,138 - $564,000
3
Beds
2
Baths
1,864
Sq Ft
$282/Sq Ft
Est. Value
About This Home
This home is located at 12 Walnut St, Townsend, MA 01469 and is currently estimated at $525,285, approximately $281 per square foot. 12 Walnut St is a home located in Middlesex County with nearby schools including North Middlesex Regional High School.
Ownership History
Date
Name
Owned For
Owner Type
Purchase Details
Closed on
Aug 5, 2010
Sold by
Connor Omar A and Connor Mandy L
Bought by
Connor Omar A and Connor Mandy L
Current Estimated Value
Purchase Details
Closed on
Aug 15, 2003
Sold by
Leblanc Donna M and Leblanc Gordon J
Bought by
Matthews Mandy and Connor Omar A
Home Financials for this Owner
Home Financials are based on the most recent Mortgage that was taken out on this home.
Original Mortgage
$250,075
Interest Rate
5.46%
Mortgage Type
Purchase Money Mortgage
Create a Home Valuation Report for This Property
The Home Valuation Report is an in-depth analysis detailing your home's value as well as a comparison with similar homes in the area
Home Values in the Area
Average Home Value in this Area
Purchase History
| Date | Buyer | Sale Price | Title Company |
|---|---|---|---|
| Connor Omar A | -- | -- | |
| Matthews Mandy | $254,000 | -- |
Source: Public Records
Mortgage History
| Date | Status | Borrower | Loan Amount |
|---|---|---|---|
| Previous Owner | Matthews Mandy | $250,075 |
Source: Public Records
Tax History Compared to Growth
Tax History
| Year | Tax Paid | Tax Assessment Tax Assessment Total Assessment is a certain percentage of the fair market value that is determined by local assessors to be the total taxable value of land and additions on the property. | Land | Improvement |
|---|---|---|---|---|
| 2025 | $5,918 | $407,600 | $91,700 | $315,900 |
| 2024 | $5,758 | $399,600 | $91,700 | $307,900 |
| 2023 | $5,730 | $375,500 | $79,200 | $296,300 |
| 2022 | $5,681 | $322,600 | $72,600 | $250,000 |
| 2021 | $5,548 | $302,700 | $71,700 | $231,000 |
| 2020 | $5,393 | $276,300 | $65,100 | $211,200 |
| 2019 | $5,151 | $266,500 | $65,100 | $201,400 |
| 2018 | $4,873 | $240,500 | $58,400 | $182,100 |
| 2017 | $4,321 | $219,700 | $61,300 | $158,400 |
| 2016 | $4,164 | $210,300 | $61,300 | $149,000 |
| 2015 | $4,044 | $211,600 | $68,000 | $143,600 |
| 2014 | $3,847 | $196,600 | $63,800 | $132,800 |
Source: Public Records
Map
Nearby Homes
- 18 Beech St
- 64 Maplewood Dr
- 144 Main St
- Lot 10 Christian Cir
- 1 Depot Street Extension Unit 5
- 1 Depot Street Extension Unit 2
- 1 Depot Street Extension Unit 3
- 1 Depot Street Extension Unit 4
- 22 Lakin St
- 10 Lakin St
- 21 Magnolia Ln
- 00 Tyler Rd
- 5 Turnpike Rd Unit 213 TWO
- 55 Beachview Rd
- 167 S Row Rd
- 64 Meadow Rd
- 102 Wheeler St
- 154 Townsend St
- 0 Tyler Rd Unit 72560808
- 30 Bailey Rd