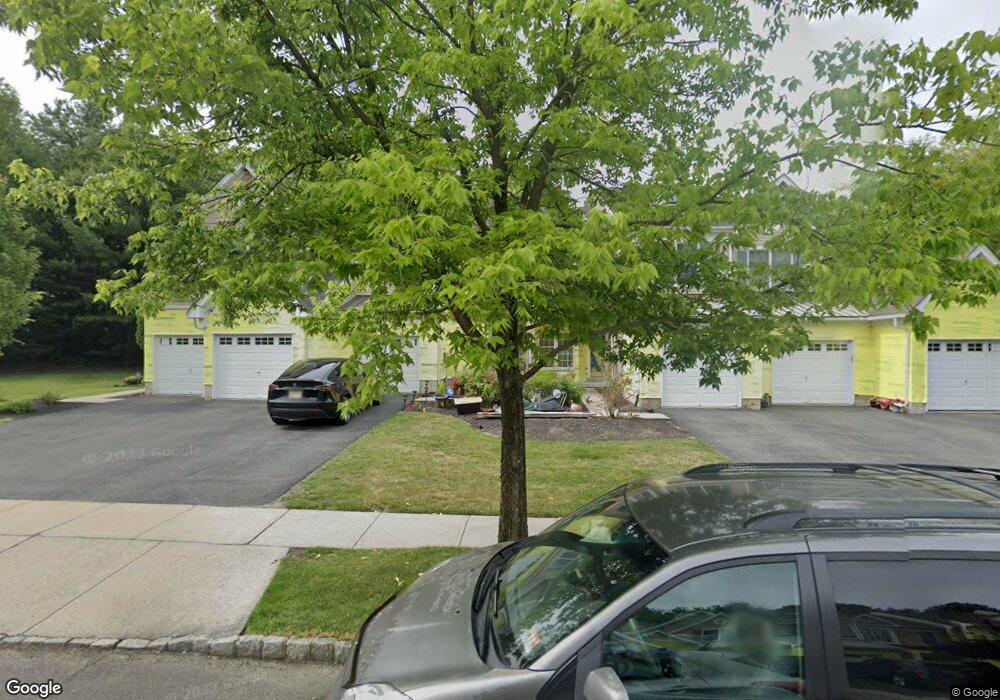
12 Wedgewood Ct Princeton, NJ 08540
Estimated Value: $821,086 - $1,200,000
--
Bed
--
Bath
2,021
Sq Ft
$459/Sq Ft
Est. Value
About This Home
This home is located at 12 Wedgewood Ct, Princeton, NJ 08540 and is currently estimated at $928,272, approximately $459 per square foot. 12 Wedgewood Ct is a home located in Mercer County with nearby schools including Village Elementary School, Dutch Neck Elementary School, and Community Middle School.
Ownership History
Date
Name
Owned For
Owner Type
Purchase Details
Closed on
May 5, 2011
Sold by
Nakka Dinesh V and Nakka Sreedevi
Bought by
Bommakanti Venkat Ram Shastry and Bommakanti Gayathri
Current Estimated Value
Home Financials for this Owner
Home Financials are based on the most recent Mortgage that was taken out on this home.
Original Mortgage
$412,000
Outstanding Balance
$272,630
Interest Rate
3.87%
Mortgage Type
New Conventional
Estimated Equity
$655,642
Purchase Details
Closed on
Nov 3, 2005
Sold by
Estates At Princeton Junction
Bought by
Nakka Dinesh and Nakka Sreedevi
Home Financials for this Owner
Home Financials are based on the most recent Mortgage that was taken out on this home.
Original Mortgage
$386,000
Interest Rate
6.28%
Create a Home Valuation Report for This Property
The Home Valuation Report is an in-depth analysis detailing your home's value as well as a comparison with similar homes in the area
Home Values in the Area
Average Home Value in this Area
Purchase History
| Date | Buyer | Sale Price | Title Company |
|---|---|---|---|
| Bommakanti Venkat Ram Shastry | $516,000 | Or | |
| Nakka Dinesh | $504,068 | -- |
Source: Public Records
Mortgage History
| Date | Status | Borrower | Loan Amount |
|---|---|---|---|
| Open | Bommakanti Venkat Ram Shastry | $412,000 | |
| Previous Owner | Nakka Dinesh | $386,000 |
Source: Public Records
Tax History Compared to Growth
Tax History
| Year | Tax Paid | Tax Assessment Tax Assessment Total Assessment is a certain percentage of the fair market value that is determined by local assessors to be the total taxable value of land and additions on the property. | Land | Improvement |
|---|---|---|---|---|
| 2025 | $15,135 | $493,800 | $199,900 | $293,900 |
| 2024 | $14,503 | $493,800 | $199,900 | $293,900 |
| 2023 | $14,503 | $493,800 | $199,900 | $293,900 |
| 2022 | $13,988 | $485,700 | $199,900 | $285,800 |
| 2021 | $13,872 | $485,700 | $199,900 | $285,800 |
| 2020 | $13,619 | $485,700 | $199,900 | $285,800 |
| 2019 | $13,464 | $485,700 | $199,900 | $285,800 |
| 2018 | $13,337 | $485,700 | $199,900 | $285,800 |
| 2017 | $13,060 | $485,700 | $199,900 | $285,800 |
| 2016 | $12,779 | $485,700 | $199,900 | $285,800 |
| 2015 | $12,482 | $485,700 | $199,900 | $285,800 |
| 2014 | $12,337 | $485,700 | $199,900 | $285,800 |
Source: Public Records
Map
Nearby Homes
- 9 Wedgewood Ct
- 10 Norbridge Dr
- 298 N Post Rd
- 1 Corio Ct
- 2 Corio Ct
- 5 Corio Ct
- 8 Corio Ct
- 10 Corio Ct
- 1 Hawk Dr
- 53 E Shrewsbury Place
- 24 Hereford Dr
- 3 Yorktowne Ct
- 951 Alexander Rd
- 17 Springhill Dr
- 43 Wallace Rd
- 18108 Donatello Dr Unit 1881
- 18105 Donatello Dr Unit 1851
- 5202 Donatello Dr
- 18103 Donatello Dr
- 8203 Donatello Dr