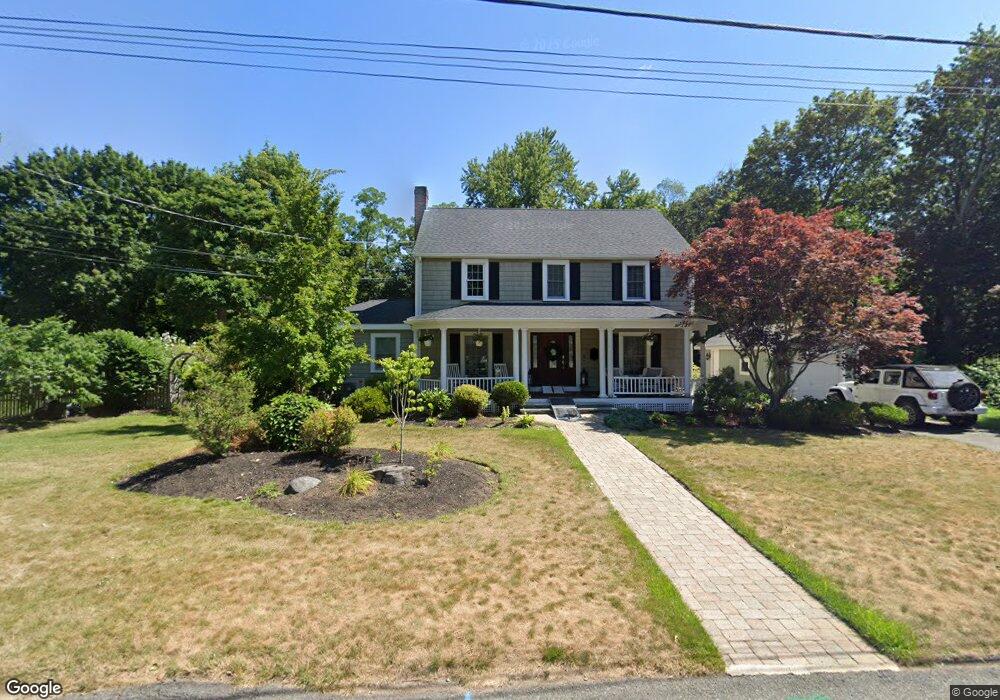
12 Weeks Rd Danvers, MA 01923
Estimated Value: $714,000 - $778,000
3
Beds
2
Baths
1,802
Sq Ft
$416/Sq Ft
Est. Value
About This Home
This home is located at 12 Weeks Rd, Danvers, MA 01923 and is currently estimated at $749,102, approximately $415 per square foot. 12 Weeks Rd is a home located in Essex County with nearby schools including Danvers High School, St. Mary of the Annunciation School, and Plumfield Academy.
Ownership History
Date
Name
Owned For
Owner Type
Purchase Details
Closed on
Dec 29, 1997
Sold by
Spearing Scott S and Spearing Pamela S
Bought by
Wolniewicz David M and Wolniewicz Catherine T
Current Estimated Value
Purchase Details
Closed on
May 20, 1992
Sold by
Connolly Mary P
Bought by
Spearing Scott S and Spearing Pamela
Create a Home Valuation Report for This Property
The Home Valuation Report is an in-depth analysis detailing your home's value as well as a comparison with similar homes in the area
Home Values in the Area
Average Home Value in this Area
Purchase History
| Date | Buyer | Sale Price | Title Company |
|---|---|---|---|
| Wolniewicz David M | $262,500 | -- | |
| Spearing Scott S | $191,000 | -- |
Source: Public Records
Mortgage History
| Date | Status | Borrower | Loan Amount |
|---|---|---|---|
| Open | Spearing Scott S | $94,000 | |
| Open | Spearing Scott S | $300,000 | |
| Closed | Spearing Scott S | $50,000 |
Source: Public Records
Tax History
| Year | Tax Paid | Tax Assessment Tax Assessment Total Assessment is a certain percentage of the fair market value that is determined by local assessors to be the total taxable value of land and additions on the property. | Land | Improvement |
|---|---|---|---|---|
| 2025 | $7,724 | $702,800 | $388,200 | $314,600 |
| 2024 | $7,658 | $689,300 | $388,200 | $301,100 |
| 2023 | $7,240 | $616,200 | $352,800 | $263,400 |
| 2022 | $7,152 | $564,900 | $320,400 | $244,500 |
| 2021 | $6,919 | $518,300 | $303,600 | $214,700 |
| 2020 | $6,723 | $514,800 | $300,100 | $214,700 |
| 2019 | $6,394 | $481,500 | $273,100 | $208,400 |
| 2018 | $6,227 | $459,900 | $270,400 | $189,500 |
| 2017 | $5,870 | $413,700 | $236,700 | $177,000 |
| 2016 | $5,653 | $398,100 | $225,900 | $172,200 |
| 2015 | $5,400 | $362,200 | $205,600 | $156,600 |
Source: Public Records
Map
Nearby Homes
- 102 Centre St
- 22 Collins St Unit 31
- 103 Newbury St Unit 1
- 10 Clark St
- 98 Newbury St Unit 18B
- 98 Newbury St Unit 23B
- 11 Spring St
- 14 Williams St Unit C17
- 43 Hobart St Unit B
- 6 Venice St Unit B3
- 22 Maple Ave
- 63 Adams St
- 97 Sylvan St Unit 7
- 11 Andover St
- 5 Holten St
- 286 Newbury St Unit 110
- 261 Newbury St Unit 17A
- 35 Locust St Unit 3
- 9 Ledgewood Way Unit 6
- 8 Ledgewood Way Unit 20
Your Personal Tour Guide
Ask me questions while you tour the home.