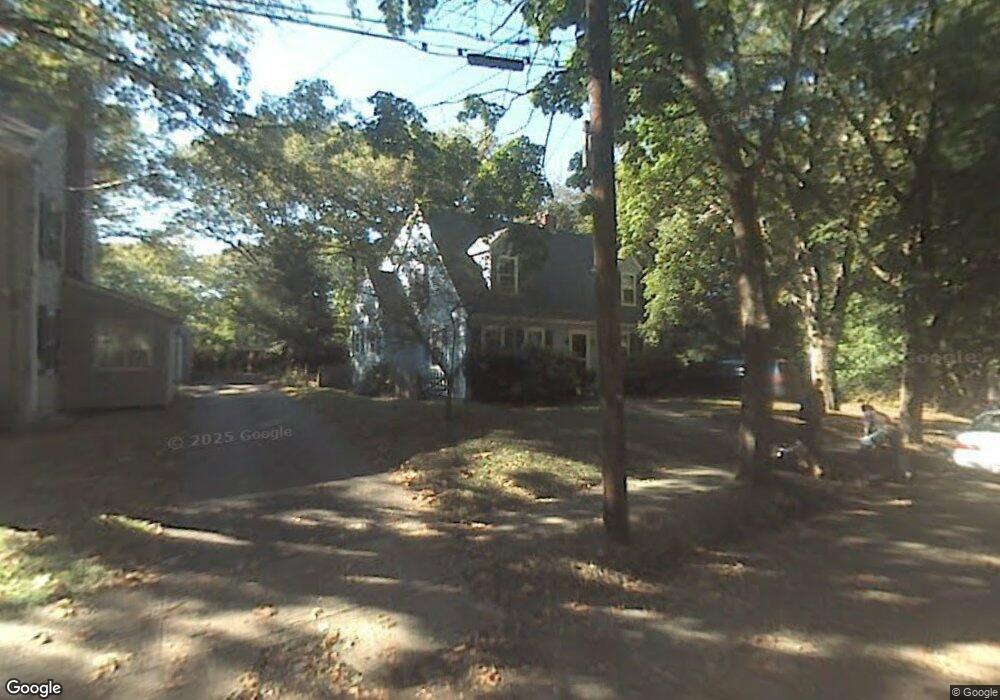
12 Wenham Rd Newton Highlands, MA 02461
Newton Highlands NeighborhoodEstimated Value: $1,724,879 - $1,941,000
4
Beds
3
Baths
2,618
Sq Ft
$698/Sq Ft
Est. Value
About This Home
This home is located at 12 Wenham Rd, Newton Highlands, MA 02461 and is currently estimated at $1,828,470, approximately $698 per square foot. 12 Wenham Rd is a home located in Middlesex County with nearby schools including Zervas Elementary School, Oak Hill Middle School, and Newton South High School.
Ownership History
Date
Name
Owned For
Owner Type
Purchase Details
Closed on
May 29, 2012
Sold by
Eden Amy H and Weinrebe James A
Bought by
James A Weinrebe 2012 and Eden Amy H
Current Estimated Value
Purchase Details
Closed on
Aug 30, 1991
Sold by
Foster Jewel W
Bought by
Weinrebe James A and Eden Amy H
Create a Home Valuation Report for This Property
The Home Valuation Report is an in-depth analysis detailing your home's value as well as a comparison with similar homes in the area
Home Values in the Area
Average Home Value in this Area
Purchase History
| Date | Buyer | Sale Price | Title Company |
|---|---|---|---|
| James A Weinrebe 2012 | -- | -- | |
| Weinrebe James A | $255,000 | -- |
Source: Public Records
Mortgage History
| Date | Status | Borrower | Loan Amount |
|---|---|---|---|
| Previous Owner | Weinrebe James A | $182,500 | |
| Previous Owner | Weinrebe James A | $219,900 | |
| Previous Owner | Weinrebe James A | $229,500 | |
| Previous Owner | Weinrebe James A | $229,500 |
Source: Public Records
Tax History Compared to Growth
Tax History
| Year | Tax Paid | Tax Assessment Tax Assessment Total Assessment is a certain percentage of the fair market value that is determined by local assessors to be the total taxable value of land and additions on the property. | Land | Improvement |
|---|---|---|---|---|
| 2025 | $13,427 | $1,370,100 | $905,900 | $464,200 |
| 2024 | $12,983 | $1,330,200 | $879,500 | $450,700 |
| 2023 | $12,138 | $1,192,300 | $664,200 | $528,100 |
| 2022 | $11,614 | $1,104,000 | $615,000 | $489,000 |
| 2021 | $12,583 | $1,041,500 | $580,200 | $461,300 |
| 2020 | $10,873 | $1,041,500 | $580,200 | $461,300 |
| 2019 | $8,724 | $834,800 | $563,300 | $271,500 |
| 2018 | $5,836 | $770,100 | $510,100 | $260,000 |
| 2017 | $8,079 | $726,500 | $481,200 | $245,300 |
| 2016 | $7,727 | $679,000 | $449,700 | $229,300 |
| 2015 | $7,368 | $634,600 | $420,300 | $214,300 |
Source: Public Records
Map
Nearby Homes
- 28 Wilson Cir Unit 28
- 32 Wilson Cir Unit 32
- 26 Wilson Cir Unit 26
- 956 Walnut St Unit 4
- 956 Walnut St Unit 7
- 956 Walnut St Unit 6
- 2 Raeburn Terrace
- 1114 Beacon St Unit 106
- 1114 Beacon St Unit 203
- 1114 Beacon St Unit 111
- 1114 Beacon St Unit 104
- 1114 Beacon St Unit 207
- 54 Garland Rd
- 35 Kingston Rd
- 1151 Walnut St Unit 205
- 1151 Walnut St Unit 405
- 1151 Walnut St Unit 207
- 1597 Centre St Unit 1597
- 1597 Centre St
- 1623-1625 Centre St
- 8 Wenham Rd
- 55 Manchester Rd
- 11 Wenham Rd
- 5 Wenham Rd
- 37 Manchester Rd
- 71 Manchester Rd
- 54 Manchester Rd
- 60 Manchester Rd
- 33 Manchester Rd Unit 1
- 33 Manchester Rd
- 33 Manchester Rd
- 44 Manchester Rd
- 66 Manchester Rd
- 11 Ipswich Rd
- 19 Ipswich Rd
- 7 Ipswich Rd
- 77 Manchester Rd
- 72 Manchester Rd
- 32 Manchester Rd
- 29 Manchester Rd