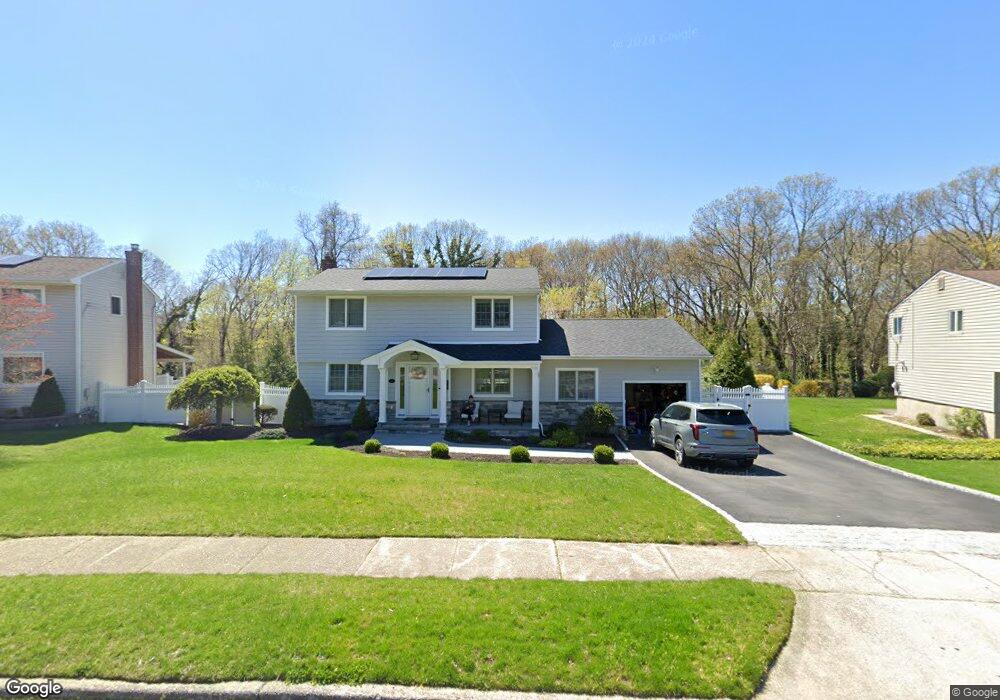
12 Wenmore Rd ComMacK, NY 11725
Estimated Value: $801,000 - $922,000
3
Beds
2
Baths
1,941
Sq Ft
$441/Sq Ft
Est. Value
About This Home
This home is located at 12 Wenmore Rd, ComMacK, NY 11725 and is currently estimated at $856,743, approximately $441 per square foot. 12 Wenmore Rd is a home located in Suffolk County with nearby schools including Sullivan Village Elementary School, Pioneer Park Elementary School, and Commack Middle School.
Ownership History
Date
Name
Owned For
Owner Type
Purchase Details
Closed on
Nov 19, 2009
Sold by
Giantomaso Richard and Giantomaso Joseph
Bought by
Rice Melissa J and Bosco Anthony R
Current Estimated Value
Home Financials for this Owner
Home Financials are based on the most recent Mortgage that was taken out on this home.
Original Mortgage
$377,500
Outstanding Balance
$246,619
Interest Rate
5.01%
Mortgage Type
Purchase Money Mortgage
Estimated Equity
$610,124
Purchase Details
Closed on
Nov 11, 2009
Sold by
Kowalski Stephen M and Kowalski Jennifer
Bought by
Friedman Ira R and Friedman Gina Persaud
Home Financials for this Owner
Home Financials are based on the most recent Mortgage that was taken out on this home.
Original Mortgage
$377,500
Outstanding Balance
$246,619
Interest Rate
5.01%
Mortgage Type
Purchase Money Mortgage
Estimated Equity
$610,124
Purchase Details
Closed on
Feb 28, 2003
Sold by
Decarlo Sadie
Bought by
Giantomaso Richard and Giantomaso Joseph
Home Financials for this Owner
Home Financials are based on the most recent Mortgage that was taken out on this home.
Original Mortgage
$292,000
Interest Rate
5.95%
Create a Home Valuation Report for This Property
The Home Valuation Report is an in-depth analysis detailing your home's value as well as a comparison with similar homes in the area
Home Values in the Area
Average Home Value in this Area
Purchase History
| Date | Buyer | Sale Price | Title Company |
|---|---|---|---|
| Rice Melissa J | $527,500 | -- | |
| Friedman Ira R | -- | -- | |
| Giantomaso Richard | $365,000 | Muro Title Agency |
Source: Public Records
Mortgage History
| Date | Status | Borrower | Loan Amount |
|---|---|---|---|
| Open | Rice Melissa J | $377,500 | |
| Closed | Friedman Ira R | $377,500 | |
| Previous Owner | Giantomaso Richard | $292,000 |
Source: Public Records
Tax History Compared to Growth
Tax History
| Year | Tax Paid | Tax Assessment Tax Assessment Total Assessment is a certain percentage of the fair market value that is determined by local assessors to be the total taxable value of land and additions on the property. | Land | Improvement |
|---|---|---|---|---|
| 2024 | $16,306 | $6,223 | $335 | $5,888 |
| 2023 | $16,306 | $6,223 | $335 | $5,888 |
| 2022 | $11,440 | $5,923 | $335 | $5,588 |
| 2021 | $11,440 | $5,923 | $335 | $5,588 |
| 2020 | $15,451 | $6,295 | $335 | $5,960 |
| 2019 | $15,451 | $0 | $0 | $0 |
| 2018 | -- | $6,295 | $335 | $5,960 |
| 2017 | $14,235 | $6,295 | $335 | $5,960 |
| 2016 | $11,586 | $5,235 | $335 | $4,900 |
| 2015 | -- | $5,235 | $335 | $4,900 |
| 2014 | -- | $5,235 | $335 | $4,900 |
Source: Public Records
Map
Nearby Homes