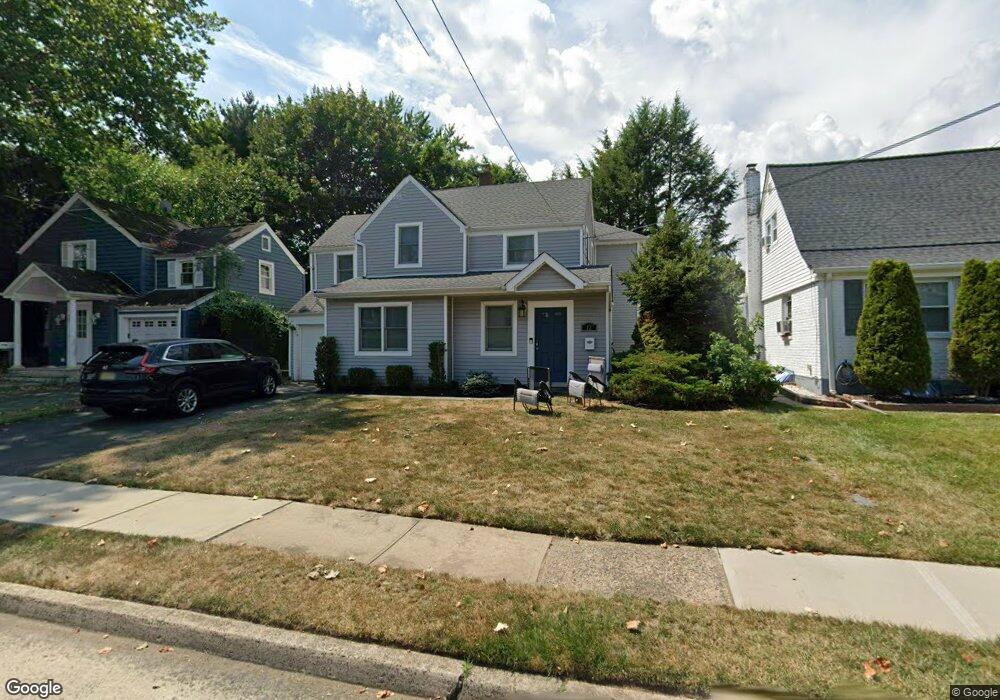
12 Wilbur Rd Bergenfield, NJ 07621
Estimated Value: $840,882 - $1,155,000
--
Bed
--
Bath
2,653
Sq Ft
$380/Sq Ft
Est. Value
About This Home
This home is located at 12 Wilbur Rd, Bergenfield, NJ 07621 and is currently estimated at $1,007,471, approximately $379 per square foot. 12 Wilbur Rd is a home located in Bergen County with nearby schools including Bergenfield High School and Torah Academy of Bergen County.
Ownership History
Date
Name
Owned For
Owner Type
Purchase Details
Closed on
Jul 31, 2002
Sold by
Herrmann Noam
Bought by
Moskowitz Elliot and Moskowitz Sharon
Current Estimated Value
Home Financials for this Owner
Home Financials are based on the most recent Mortgage that was taken out on this home.
Original Mortgage
$250,000
Outstanding Balance
$106,241
Interest Rate
6.61%
Estimated Equity
$901,230
Purchase Details
Closed on
Sep 3, 1999
Sold by
Rolnick Paul and Rolnick Aviva
Bought by
Herrmann Noam and Herrmann Tova
Home Financials for this Owner
Home Financials are based on the most recent Mortgage that was taken out on this home.
Original Mortgage
$160,000
Interest Rate
8.1%
Purchase Details
Closed on
Dec 28, 1994
Sold by
Collopy Harry
Bought by
Rolnick Paul and Rolnick Aviva
Home Financials for this Owner
Home Financials are based on the most recent Mortgage that was taken out on this home.
Original Mortgage
$136,000
Interest Rate
9.23%
Create a Home Valuation Report for This Property
The Home Valuation Report is an in-depth analysis detailing your home's value as well as a comparison with similar homes in the area
Home Values in the Area
Average Home Value in this Area
Purchase History
| Date | Buyer | Sale Price | Title Company |
|---|---|---|---|
| Moskowitz Elliot | $330,000 | -- | |
| Herrmann Noam | $218,000 | -- | |
| Rolnick Paul | $171,000 | -- |
Source: Public Records
Mortgage History
| Date | Status | Borrower | Loan Amount |
|---|---|---|---|
| Open | Moskowitz Elliot | $250,000 | |
| Previous Owner | Herrmann Noam | $160,000 | |
| Previous Owner | Rolnick Paul | $136,000 |
Source: Public Records
Tax History Compared to Growth
Tax History
| Year | Tax Paid | Tax Assessment Tax Assessment Total Assessment is a certain percentage of the fair market value that is determined by local assessors to be the total taxable value of land and additions on the property. | Land | Improvement |
|---|---|---|---|---|
| 2025 | $16,344 | $463,400 | $175,000 | $288,400 |
| 2024 | $15,802 | $463,400 | $175,000 | $288,400 |
| 2023 | $15,556 | $463,400 | $175,000 | $288,400 |
| 2022 | $15,556 | $463,400 | $175,000 | $288,400 |
| 2021 | $15,394 | $463,400 | $175,000 | $288,400 |
| 2020 | $15,292 | $463,400 | $175,000 | $288,400 |
| 2019 | $15,116 | $463,400 | $175,000 | $288,400 |
| 2018 | $15,005 | $463,400 | $175,000 | $288,400 |
| 2017 | $14,931 | $463,400 | $175,000 | $288,400 |
| 2016 | $14,694 | $463,400 | $175,000 | $288,400 |
| 2015 | $14,467 | $463,400 | $175,000 | $288,400 |
| 2014 | $14,203 | $463,400 | $175,000 | $288,400 |
Source: Public Records
Map
Nearby Homes
- 201 Maiden Ln
- 388 S Prospect Ave
- 98 John Place
- 55 Maiden Ln
- 10 Judith Place
- 207 Melrose Ave
- 21 Briarcliffe Rd
- 42 Westview Dr
- 70 Greenwich St
- 466 New Bridge Rd
- 64 Glenwood Dr S
- 15 Brown Place
- 111 Dudley Dr
- 17 S Paula Dr
- 532 Winthrop Rd
- 12 Lerome Place
- 512 Warwick Ave Unit 3A
- 15 Westside Ave
- 591 Warwick Ave
- 86 Levitt Ave