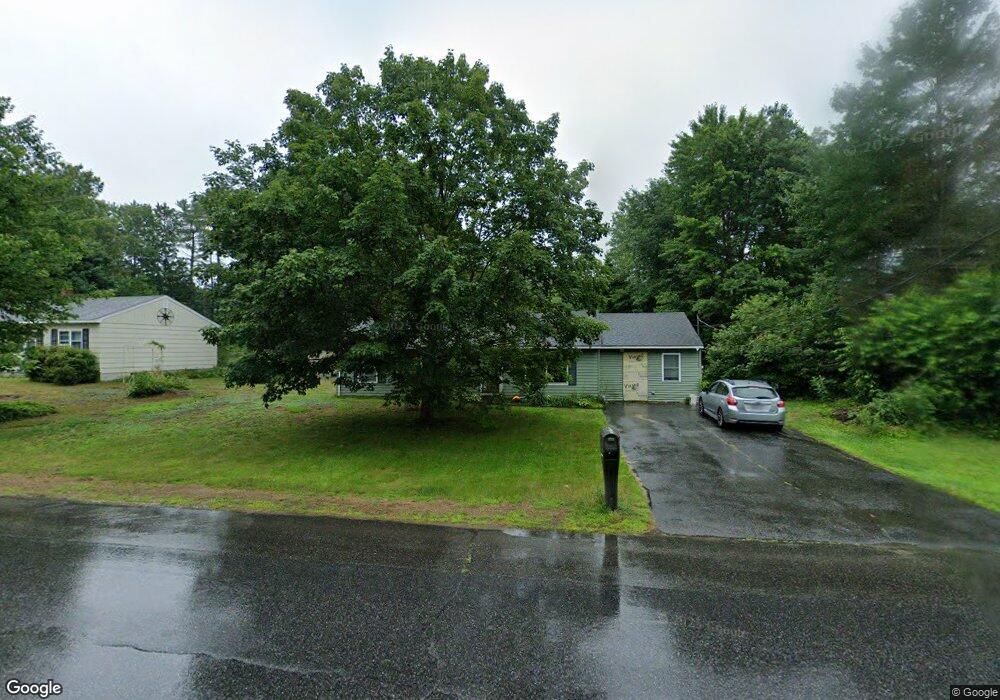
12 Wing St Lisbon Falls, ME 04252
Estimated Value: $312,134 - $362,000
4
Beds
1
Bath
1,376
Sq Ft
$251/Sq Ft
Est. Value
About This Home
This home is located at 12 Wing St, Lisbon Falls, ME 04252 and is currently estimated at $345,284, approximately $250 per square foot. 12 Wing St is a home located in Androscoggin County with nearby schools including Lisbon Community School, Philip W. Sugg Middle School, and Lisbon High School.
Ownership History
Date
Name
Owned For
Owner Type
Purchase Details
Closed on
Mar 1, 2010
Sold by
Holbrook Jason L and Holbrook Heather N
Bought by
Allen Christine A and Allen Jason R
Current Estimated Value
Home Financials for this Owner
Home Financials are based on the most recent Mortgage that was taken out on this home.
Original Mortgage
$142,800
Outstanding Balance
$95,258
Interest Rate
5.11%
Mortgage Type
Commercial
Estimated Equity
$250,026
Purchase Details
Closed on
Oct 21, 2005
Sold by
King Kerry L and King Emily N
Bought by
Holbrook Jason L and Holbrook Heather N
Home Financials for this Owner
Home Financials are based on the most recent Mortgage that was taken out on this home.
Original Mortgage
$110,400
Interest Rate
7%
Mortgage Type
Commercial
Create a Home Valuation Report for This Property
The Home Valuation Report is an in-depth analysis detailing your home's value as well as a comparison with similar homes in the area
Home Values in the Area
Average Home Value in this Area
Purchase History
| Date | Buyer | Sale Price | Title Company |
|---|---|---|---|
| Allen Christine A | -- | -- | |
| Holbrook Jason L | -- | -- |
Source: Public Records
Mortgage History
| Date | Status | Borrower | Loan Amount |
|---|---|---|---|
| Open | Allen Christine A | $142,800 | |
| Previous Owner | Allen Christine A | $145,000 | |
| Previous Owner | Holbrook Jason L | $110,400 | |
| Previous Owner | Holbrook Jason L | $27,600 |
Source: Public Records
Tax History Compared to Growth
Tax History
| Year | Tax Paid | Tax Assessment Tax Assessment Total Assessment is a certain percentage of the fair market value that is determined by local assessors to be the total taxable value of land and additions on the property. | Land | Improvement |
|---|---|---|---|---|
| 2024 | $3,192 | $234,700 | $55,700 | $179,000 |
| 2023 | $2,773 | $131,400 | $36,800 | $94,600 |
| 2022 | $3,035 | $131,400 | $36,800 | $94,600 |
| 2021 | $2,904 | $131,400 | $36,800 | $94,600 |
| 2020 | $3,035 | $131,400 | $36,800 | $94,600 |
| 2019 | $3,035 | $131,400 | $36,800 | $94,600 |
| 2018 | $2,847 | $114,600 | $32,000 | $82,600 |
| 2017 | $2,659 | $114,600 | $32,000 | $82,600 |
| 2016 | $2,567 | $114,600 | $32,000 | $82,600 |
| 2015 | $2,236 | $103,500 | $33,000 | $70,500 |
| 2014 | $2,316 | $103,500 | $33,000 | $70,500 |
| 2013 | -- | $103,500 | $33,000 | $70,500 |
Source: Public Records
Map
Nearby Homes