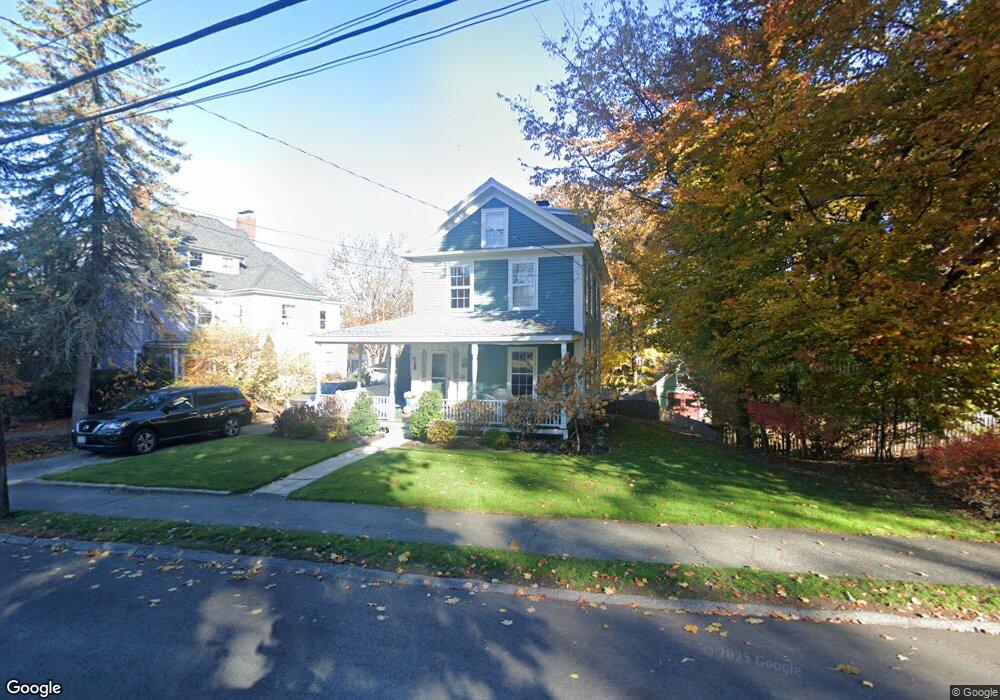
12 Winthrop St Winchester, MA 01890
Estimated Value: $1,212,000 - $1,376,000
2
Beds
2
Baths
1,643
Sq Ft
$795/Sq Ft
Est. Value
About This Home
This home is located at 12 Winthrop St, Winchester, MA 01890 and is currently estimated at $1,306,647, approximately $795 per square foot. 12 Winthrop St is a home located in Middlesex County with nearby schools including Lincoln Elementary School, McCall Middle School, and Winchester High School.
Ownership History
Date
Name
Owned For
Owner Type
Purchase Details
Closed on
Jan 13, 2022
Sold by
Carzo Mark W and Carzo Susan A
Bought by
Mark W Carzo T
Current Estimated Value
Purchase Details
Closed on
Dec 13, 2002
Sold by
Kissling Lawrence J and Kissling Constance D
Bought by
Carzo Mark W and Carzo Susan A
Home Financials for this Owner
Home Financials are based on the most recent Mortgage that was taken out on this home.
Original Mortgage
$519,200
Interest Rate
6.17%
Mortgage Type
Purchase Money Mortgage
Purchase Details
Closed on
Aug 25, 1999
Sold by
Laats Alexander and Laats Laura F
Bought by
Kissling Lawrence and Kissling Constance D
Home Financials for this Owner
Home Financials are based on the most recent Mortgage that was taken out on this home.
Original Mortgage
$330,000
Interest Rate
7.53%
Mortgage Type
Purchase Money Mortgage
Purchase Details
Closed on
Sep 10, 1993
Sold by
Edmands John H and Edmands Katharine
Bought by
Laats Alexander and Laats Laura F
Create a Home Valuation Report for This Property
The Home Valuation Report is an in-depth analysis detailing your home's value as well as a comparison with similar homes in the area
Purchase History
We collect this data history from publicly available records. To have your information removed, we recommend requesting removal directly through your county’s website.
| Date | Buyer | Sale Price | Title Company |
|---|---|---|---|
| Mark W Carzo T | -- | None Available | |
| Carzo Mark W | $649,000 | -- | |
| Kissling Lawrence | $412,500 | -- | |
| Laats Alexander | $265,000 | -- |
Source: Public Records
Mortgage History
We collect this data history from publicly available records. To have your information removed, we recommend requesting removal directly through your county’s website.
| Date | Status | Borrower | Loan Amount |
|---|---|---|---|
| Previous Owner | Laats Alexander | $265,000 | |
| Previous Owner | Carzo Mark W | $519,200 | |
| Previous Owner | Laats Alexander | $330,000 | |
| Previous Owner | Laats Alexander | $50,000 |
Source: Public Records
Tax History
| Year | Tax Paid | Tax Assessment Tax Assessment Total Assessment is a certain percentage of the fair market value that is determined by local assessors to be the total taxable value of land and additions on the property. | Land | Improvement |
|---|---|---|---|---|
| 2025 | $143 | $1,286,900 | $852,200 | $434,700 |
| 2024 | $13,512 | $1,192,600 | $791,400 | $401,200 |
| 2023 | $13,233 | $1,121,400 | $730,500 | $390,900 |
| 2022 | $12,631 | $1,009,700 | $639,200 | $370,500 |
| 2021 | $12,271 | $956,400 | $585,900 | $370,500 |
| 2020 | $11,737 | $947,300 | $585,900 | $361,400 |
| 2019 | $10,550 | $871,200 | $509,800 | $361,400 |
| 2018 | $10,199 | $836,700 | $485,500 | $351,200 |
| 2017 | $10,025 | $816,400 | $485,500 | $330,900 |
| 2016 | $9,416 | $806,200 | $485,500 | $320,700 |
| 2015 | $9,103 | $749,800 | $441,300 | $308,500 |
| 2014 | $8,448 | $667,300 | $369,100 | $298,200 |
Source: Public Records
Map
Nearby Homes
- 129 Washington St Unit 131
- 2 Eaton Ct
- 10 Rangeley Rd
- 666 Main St Unit 315
- 6 Hancock St
- 40 Lake St Unit I
- 53 Lake St
- 200 Swanton St Unit 228
- 200 Swanton St Unit 538
- 200 Swanton St Unit 318
- 200 Swanton St Unit 717
- 200 Swanton St Unit T35
- 2 Everett Ave
- 18 Middlesex St
- 83 Church St Unit 15
- 63-65 Harvard St
- 112 Highland Ave
- 6 Ivy Cir
- 237 Swanton St
- 50 Brooks St
- 14 Winthrop St
- 14 Winthrop St Unit 14
- 10 Winthrop St Unit 10A
- 10 Winthrop St
- 15 Winthrop St
- 2 Hillside Ave
- 193 Mystic Valley Pkwy
- 13 Winthrop St
- 8 Winthrop St
- 9 Winthrop St
- 2 Winthrop St Unit /
- 2 Winthrop St
- 0 Crossman Rd Unit 70792062
- 0 Crossman Rd Unit 70797358
- 197 Mystic Valley Pkwy
- 18 Winthrop St
- 3 Crescent Rd
- 4 Hillside Ave
- 7 Winthrop St
- 6 Winthrop St
Your Personal Tour Guide
Ask me questions while you tour the home.