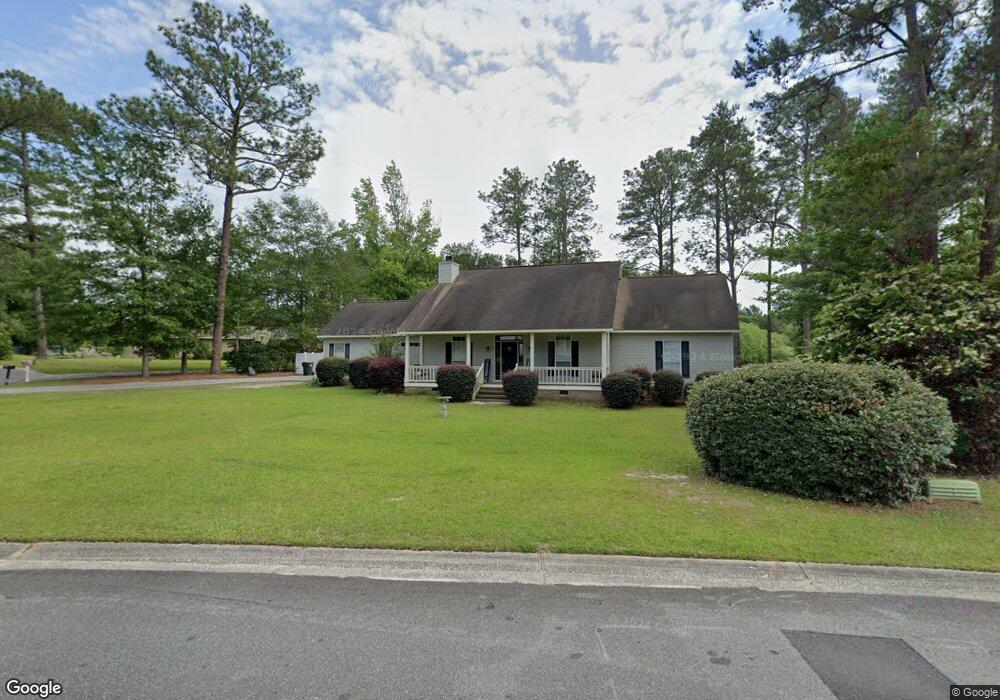
12 Wiregrass Cir Moultrie, GA 31768
Estimated Value: $267,922 - $360,000
--
Bed
2
Baths
1,852
Sq Ft
$164/Sq Ft
Est. Value
About This Home
This home is located at 12 Wiregrass Cir, Moultrie, GA 31768 and is currently estimated at $303,231, approximately $163 per square foot. 12 Wiregrass Cir is a home located in Colquitt County with nearby schools including Sunset Elementary School, Willie J. Williams Middle School, and C.A. Gray Junior High School.
Ownership History
Date
Name
Owned For
Owner Type
Purchase Details
Closed on
Jul 19, 2018
Sold by
Baker Kashima
Bought by
Baker Kashima and Lattimore Kashima
Current Estimated Value
Home Financials for this Owner
Home Financials are based on the most recent Mortgage that was taken out on this home.
Original Mortgage
$176,641
Outstanding Balance
$152,765
Interest Rate
4.5%
Mortgage Type
FHA
Estimated Equity
$150,466
Purchase Details
Closed on
Jun 18, 2018
Sold by
Walters Jerry
Bought by
Kashima Baker
Home Financials for this Owner
Home Financials are based on the most recent Mortgage that was taken out on this home.
Original Mortgage
$176,641
Outstanding Balance
$152,765
Interest Rate
4.5%
Mortgage Type
FHA
Estimated Equity
$150,466
Purchase Details
Closed on
Dec 12, 2003
Sold by
Plunkett Robert P
Bought by
Walters Jerry
Purchase Details
Closed on
Dec 14, 1998
Bought by
Plunkett Robert P
Create a Home Valuation Report for This Property
The Home Valuation Report is an in-depth analysis detailing your home's value as well as a comparison with similar homes in the area
Home Values in the Area
Average Home Value in this Area
Purchase History
| Date | Buyer | Sale Price | Title Company |
|---|---|---|---|
| Baker Kashima | -- | -- | |
| Kashima Baker | $179,900 | -- | |
| Walters Jerry | $138,500 | -- | |
| Plunkett Robert P | $8,500 | -- | |
| Doss Jane | $8,500 | -- |
Source: Public Records
Mortgage History
| Date | Status | Borrower | Loan Amount |
|---|---|---|---|
| Open | Kashima Baker | $176,641 |
Source: Public Records
Tax History Compared to Growth
Tax History
| Year | Tax Paid | Tax Assessment Tax Assessment Total Assessment is a certain percentage of the fair market value that is determined by local assessors to be the total taxable value of land and additions on the property. | Land | Improvement |
|---|---|---|---|---|
| 2024 | $2,706 | $89,655 | $12,000 | $77,655 |
| 2023 | $2,706 | $79,716 | $12,000 | $67,716 |
| 2022 | $2,248 | $67,142 | $12,000 | $55,142 |
| 2021 | $2,187 | $64,489 | $12,000 | $52,489 |
| 2020 | $2,224 | $64,489 | $12,000 | $52,489 |
| 2019 | $2,383 | $61,393 | $12,000 | $49,393 |
| 2018 | $2,444 | $61,206 | $12,000 | $49,206 |
| 2017 | $2,293 | $61,206 | $12,000 | $49,206 |
| 2016 | $2,390 | $61,206 | $12,000 | $49,206 |
| 2015 | $2,589 | $66,021 | $12,000 | $54,021 |
| 2014 | $2,652 | $66,021 | $12,000 | $54,021 |
| 2013 | -- | $66,020 | $12,000 | $54,020 |
Source: Public Records
Map
Nearby Homes
- 5 Bracken Dr
- 10 Hummingbird Rd
- Lot 3 Hummingbird Ln
- 304 Clubview Dr
- 39 Hummingbird Rd
- 445 Tanglewood Dr
- 5 Marys Ln SE
- 64 Mcintosh Place SE
- 30 Marys Ln
- 3 Baell Trace Ct SE
- 204 Nandina Dr
- 7 SE Pheasant Ln
- 0 26th Ave SE
- 213 Baell Trace Ct SE
- 205 Baell Trace Ct SE
- 210 Baell Trace Ct SE
- 208 Baell Trace Ct SE
- 0 S Main St
- 135 Southlake Dr
- 114 Baell Trace Ct SE
- 14 Wiregrass Cir
- 8 Wiregrass Cir
- 13 Wiregrass Cir
- 9 Wiregrass Cir
- 6 Wiregrass Cir
- 3 Bracken Dr
- 4 Wiregrass Cir
- 2 Bracken Dr
- 20 Wiregrass Cir
- 510 Clubview Dr
- 5 Wiregrass Cir
- 21 Wiregrass Cir
- 231 Lakeshore Dr
- 2000 Wiregrass Cir
- 8 Bracken Dr
- 7 Bracken Dr
- 23 Wiregrass Cir
- 227 Lakeshore Dr
- 24 Wiregrass Cir
- 310 Holly Trail