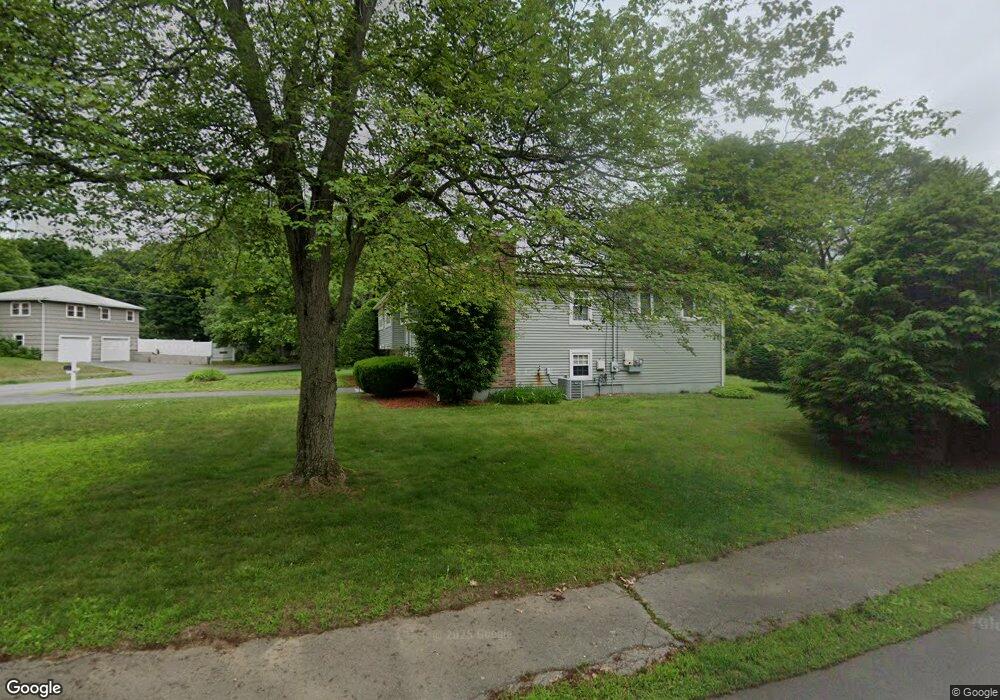
12 Woodruff Rd Walpole, MA 02081
Estimated Value: $667,000 - $763,000
3
Beds
2
Baths
1,374
Sq Ft
$519/Sq Ft
Est. Value
About This Home
This home is located at 12 Woodruff Rd, Walpole, MA 02081 and is currently estimated at $713,063, approximately $518 per square foot. 12 Woodruff Rd is a home located in Norfolk County with nearby schools including Fisher School, Walpole Middle School, and Walpole High School.
Ownership History
Date
Name
Owned For
Owner Type
Purchase Details
Closed on
Apr 21, 1989
Sold by
Greene Gene F
Bought by
Brau Robert G
Current Estimated Value
Create a Home Valuation Report for This Property
The Home Valuation Report is an in-depth analysis detailing your home's value as well as a comparison with similar homes in the area
Home Values in the Area
Average Home Value in this Area
Purchase History
| Date | Buyer | Sale Price | Title Company |
|---|---|---|---|
| Brau Robert G | $210,000 | -- |
Source: Public Records
Mortgage History
| Date | Status | Borrower | Loan Amount |
|---|---|---|---|
| Open | Brau Robert G | $254,000 | |
| Closed | Brau Robert G | $89,372 |
Source: Public Records
Tax History
| Year | Tax Paid | Tax Assessment Tax Assessment Total Assessment is a certain percentage of the fair market value that is determined by local assessors to be the total taxable value of land and additions on the property. | Land | Improvement |
|---|---|---|---|---|
| 2025 | $7,940 | $618,900 | $339,600 | $279,300 |
| 2024 | $7,765 | $587,400 | $326,500 | $260,900 |
| 2023 | $7,396 | $532,500 | $283,900 | $248,600 |
| 2022 | $7,002 | $484,200 | $263,000 | $221,200 |
| 2021 | $6,736 | $453,900 | $248,000 | $205,900 |
| 2020 | $6,653 | $443,800 | $234,000 | $209,800 |
| 2019 | $6,427 | $425,600 | $225,000 | $200,600 |
| 2018 | $6,131 | $401,500 | $217,200 | $184,300 |
| 2017 | $5,928 | $386,700 | $208,900 | $177,800 |
| 2016 | $5,765 | $370,500 | $200,900 | $169,600 |
| 2015 | $5,555 | $353,800 | $191,500 | $162,300 |
| 2014 | $5,242 | $332,600 | $191,500 | $141,100 |
Source: Public Records
Map
Nearby Homes
- 8 Mckinley Ave
- 38 Garden Pkwy
- 291 Plimpton St
- 7 Tilton Ct Unit Ct
- 40 Endean Dr
- 5 Endicott St Unit 3
- 56 North St
- 19 and 23 Arlington Ln
- 363 - 367 Washington St
- 26 Albemarle Rd
- 65 Alandale Pkwy
- 74 Alandale Pkwy
- 70 Endicott St Unit 401
- 120 Polley Ln
- 26 Dover Dr
- 53 Tremont St
- 2 Kendall St
- 0 Charlotte Rd
- 14 Wood Dr
- 881 Main St Unit 9
Your Personal Tour Guide
Ask me questions while you tour the home.