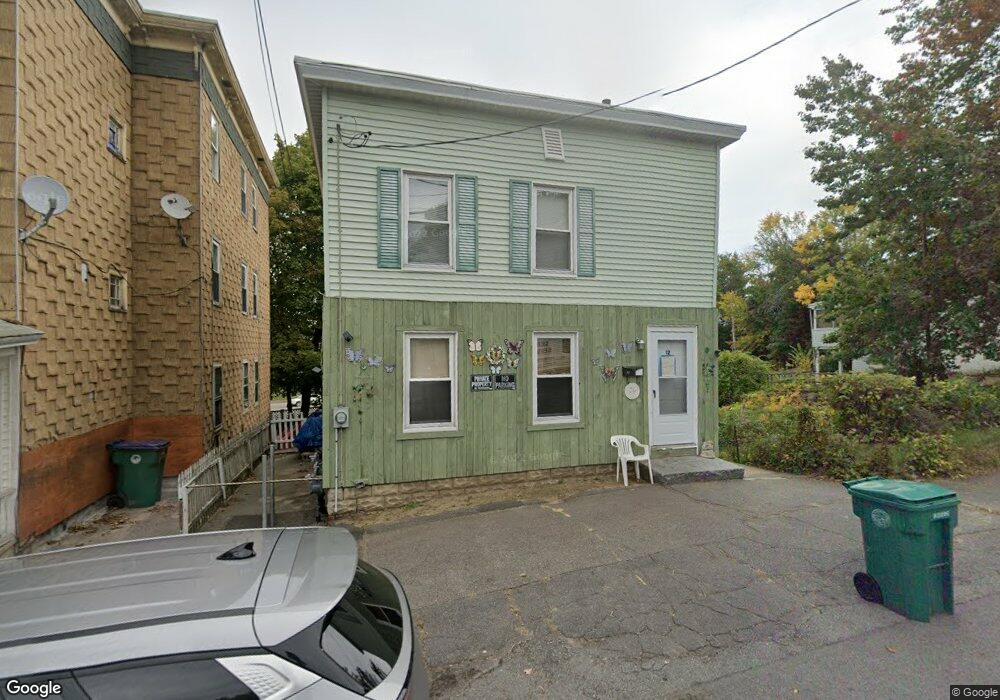
12 Worcester St Fitchburg, MA 01420
Estimated Value: $312,000 - $343,000
2
Beds
2
Baths
1,534
Sq Ft
$213/Sq Ft
Est. Value
About This Home
This home is located at 12 Worcester St, Fitchburg, MA 01420 and is currently estimated at $326,720, approximately $212 per square foot. 12 Worcester St is a home located in Worcester County with nearby schools including South Street Elementary School, Crocker Elementary School, and Reingold Elementary School.
Ownership History
Date
Name
Owned For
Owner Type
Purchase Details
Closed on
Aug 3, 1999
Sold by
Department Of Housing & Urban Dev
Bought by
Benda Ronald and Benda Edith L
Current Estimated Value
Home Financials for this Owner
Home Financials are based on the most recent Mortgage that was taken out on this home.
Original Mortgage
$63,600
Outstanding Balance
$18,219
Interest Rate
7.61%
Mortgage Type
Purchase Money Mortgage
Estimated Equity
$308,501
Purchase Details
Closed on
Jun 3, 1998
Sold by
Jackson John H and Ge Capital Mtg Service
Bought by
Ge Capital Mtg Service
Purchase Details
Closed on
Nov 14, 1988
Sold by
Dnatini Michael P
Bought by
Jackson John H
Home Financials for this Owner
Home Financials are based on the most recent Mortgage that was taken out on this home.
Original Mortgage
$89,371
Interest Rate
10.36%
Mortgage Type
Purchase Money Mortgage
Create a Home Valuation Report for This Property
The Home Valuation Report is an in-depth analysis detailing your home's value as well as a comparison with similar homes in the area
Home Values in the Area
Average Home Value in this Area
Purchase History
| Date | Buyer | Sale Price | Title Company |
|---|---|---|---|
| Benda Ronald | $26,500 | -- | |
| Ge Capital Mtg Service | $105,833 | -- | |
| Jackson John H | $88,000 | -- |
Source: Public Records
Mortgage History
| Date | Status | Borrower | Loan Amount |
|---|---|---|---|
| Open | Jackson John H | $63,600 | |
| Previous Owner | Jackson John H | $88,489 | |
| Previous Owner | Jackson John H | $89,371 | |
| Previous Owner | Jackson John H | $33,000 |
Source: Public Records
Tax History Compared to Growth
Tax History
| Year | Tax Paid | Tax Assessment Tax Assessment Total Assessment is a certain percentage of the fair market value that is determined by local assessors to be the total taxable value of land and additions on the property. | Land | Improvement |
|---|---|---|---|---|
| 2025 | $33 | $246,300 | $70,500 | $175,800 |
| 2024 | $2,881 | $194,500 | $42,200 | $152,300 |
| 2023 | $2,877 | $179,600 | $32,400 | $147,200 |
| 2022 | $2,835 | $161,000 | $28,500 | $132,500 |
| 2021 | $2,678 | $140,700 | $21,600 | $119,100 |
| 2020 | $2,483 | $126,000 | $17,700 | $108,300 |
| 2019 | $2,272 | $110,900 | $24,600 | $86,300 |
| 2018 | $2,051 | $97,600 | $22,600 | $75,000 |
| 2017 | $1,900 | $88,400 | $20,600 | $67,800 |
| 2016 | $1,768 | $83,300 | $20,600 | $62,700 |
| 2015 | $1,814 | $87,700 | $21,600 | $66,100 |
| 2014 | $1,739 | $87,700 | $21,600 | $66,100 |
Source: Public Records
Map
Nearby Homes
- 8 Worcester St
- 20 Worcester St
- 213 Water St Unit 215
- 243 Water St
- 8 Nashua St
- 8 Nashua St Unit 3
- 213-215 Water St
- 225 Water St
- 15 Worcester St
- 12 Nashua St
- 12 Nashua St Unit 3
- 12 Nashua St Unit 2
- 12 Nashua St Unit 1st
- 21 Worcester St
- Lot 1 St Anthony St
- Lot 1A Oakland St
- Lot 1 Saint Anthony St
- lot 1 Shea St
- lot 1 Shea St
- Lot 1 Roosevelt St