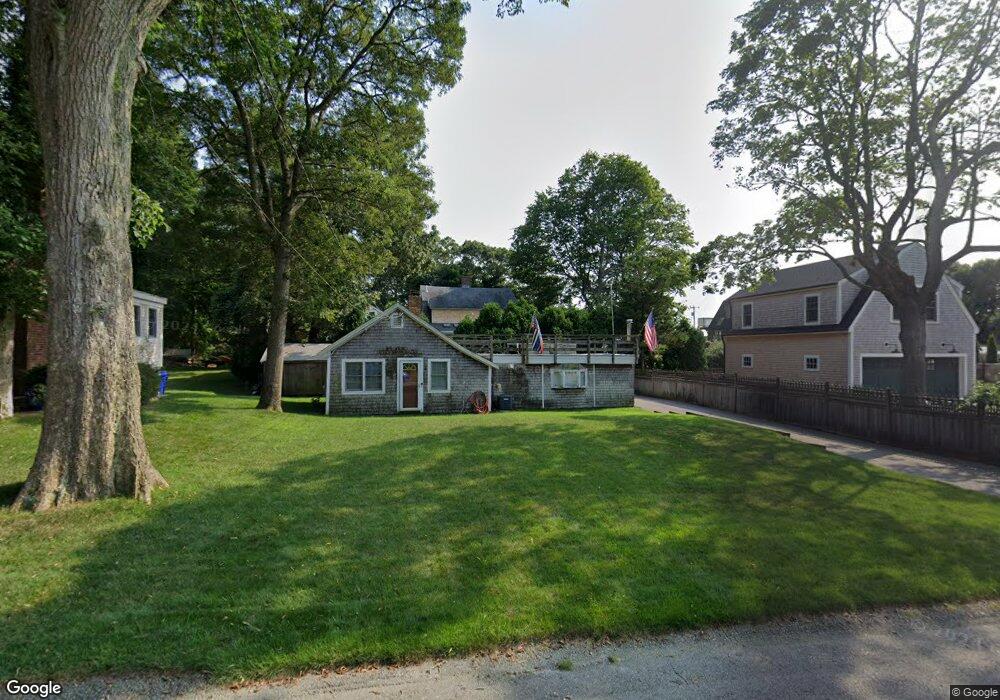
12 Wyman Ave Bourne, MA 2532
Monument Beach NeighborhoodEstimated Value: $298,000 - $454,000
1
Bed
1
Bath
780
Sq Ft
$498/Sq Ft
Est. Value
About This Home
This home is located at 12 Wyman Ave, Bourne, MA 2532 and is currently estimated at $388,666, approximately $498 per square foot. 12 Wyman Ave is a home located in Barnstable County with nearby schools including Bourne High School, St Margaret Regional School, and Cadence Academy Preschool - Bourne.
Ownership History
Date
Name
Owned For
Owner Type
Purchase Details
Closed on
Jan 15, 2004
Sold by
Schofield Joanna B
Bought by
Blunt Hugh F
Current Estimated Value
Home Financials for this Owner
Home Financials are based on the most recent Mortgage that was taken out on this home.
Original Mortgage
$125,000
Outstanding Balance
$58,782
Interest Rate
5.98%
Mortgage Type
Purchase Money Mortgage
Estimated Equity
$329,884
Purchase Details
Closed on
Jul 29, 1994
Sold by
Thompson Ralph H and Thompson Irene J
Bought by
Schofield Joanna B
Create a Home Valuation Report for This Property
The Home Valuation Report is an in-depth analysis detailing your home's value as well as a comparison with similar homes in the area
Home Values in the Area
Average Home Value in this Area
Purchase History
| Date | Buyer | Sale Price | Title Company |
|---|---|---|---|
| Blunt Hugh F | $180,000 | -- | |
| Blunt Hugh F | $180,000 | -- | |
| Schofield Joanna B | $45,000 | -- | |
| Schofield Joanna B | $45,000 | -- |
Source: Public Records
Mortgage History
| Date | Status | Borrower | Loan Amount |
|---|---|---|---|
| Open | Schofield Joanna B | $125,000 | |
| Closed | Schofield Joanna B | $125,000 |
Source: Public Records
Tax History Compared to Growth
Tax History
| Year | Tax Paid | Tax Assessment Tax Assessment Total Assessment is a certain percentage of the fair market value that is determined by local assessors to be the total taxable value of land and additions on the property. | Land | Improvement |
|---|---|---|---|---|
| 2025 | $2,682 | $343,400 | $213,800 | $129,600 |
| 2024 | $2,623 | $327,000 | $203,600 | $123,400 |
| 2023 | $2,550 | $289,500 | $180,200 | $109,300 |
| 2022 | $2,613 | $259,000 | $172,300 | $86,700 |
| 2021 | $2,538 | $235,700 | $156,800 | $78,900 |
| 2020 | $2,471 | $230,100 | $155,300 | $74,800 |
| 2019 | $2,374 | $225,900 | $155,300 | $70,600 |
| 2018 | $2,229 | $211,500 | $147,900 | $63,600 |
| 2017 | $2,101 | $204,000 | $141,100 | $62,900 |
| 2016 | $1,955 | $192,400 | $141,100 | $51,300 |
| 2015 | $1,937 | $192,400 | $141,100 | $51,300 |
Source: Public Records
Map
Nearby Homes