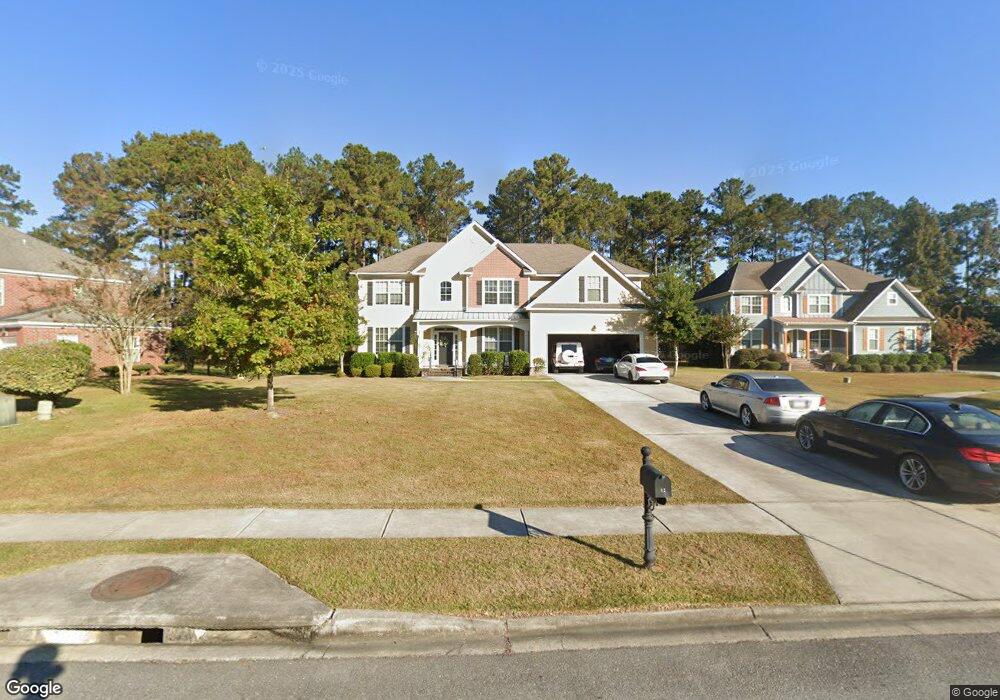
12 Wyndy Ct Pooler, GA 31322
Estimated Value: $706,580 - $895,000
5
Beds
3
Baths
4,200
Sq Ft
$182/Sq Ft
Est. Value
About This Home
This home is located at 12 Wyndy Ct, Pooler, GA 31322 and is currently estimated at $765,645, approximately $182 per square foot. 12 Wyndy Ct is a home located in Chatham County with nearby schools including Godley Station School, Groves High School, and Savannah Adventist Christian School.
Ownership History
Date
Name
Owned For
Owner Type
Purchase Details
Closed on
Jun 30, 2016
Sold by
Faircloth Homes Of Savannah Inc
Bought by
Morris Denise R and Morris Cleon J
Current Estimated Value
Home Financials for this Owner
Home Financials are based on the most recent Mortgage that was taken out on this home.
Original Mortgage
$379,810
Outstanding Balance
$302,355
Interest Rate
3.66%
Mortgage Type
New Conventional
Estimated Equity
$463,290
Purchase Details
Closed on
Dec 21, 2012
Sold by
Green Choice Custom Homes
Bought by
Faircloth Homes Of Savannah In
Purchase Details
Closed on
Dec 19, 2012
Sold by
Hallmark Development Co In
Bought by
Green Choice Custom Homes Llc
Purchase Details
Closed on
Dec 5, 2012
Sold by
Hallmark Development Co In
Bought by
Green Choice Custom Homes Llc
Purchase Details
Closed on
Aug 24, 2007
Bought by
Hallmark Development Co Inc
Create a Home Valuation Report for This Property
The Home Valuation Report is an in-depth analysis detailing your home's value as well as a comparison with similar homes in the area
Home Values in the Area
Average Home Value in this Area
Purchase History
| Date | Buyer | Sale Price | Title Company |
|---|---|---|---|
| Morris Denise R | $399,800 | -- | |
| Faircloth Homes Of Savannah In | -- | -- | |
| Green Choice Custom Homes Llc | $350,000 | -- | |
| Green Choice Custom Homes Llc | $350,000 | -- | |
| Hallmark Development Co Inc | $872,000 | -- |
Source: Public Records
Mortgage History
| Date | Status | Borrower | Loan Amount |
|---|---|---|---|
| Open | Morris Denise R | $379,810 |
Source: Public Records
Tax History Compared to Growth
Tax History
| Year | Tax Paid | Tax Assessment Tax Assessment Total Assessment is a certain percentage of the fair market value that is determined by local assessors to be the total taxable value of land and additions on the property. | Land | Improvement |
|---|---|---|---|---|
| 2025 | $10,189 | $277,120 | $25,600 | $251,520 |
| 2024 | $10,189 | $272,080 | $23,040 | $249,040 |
| 2023 | $7,105 | $222,520 | $23,040 | $199,480 |
| 2022 | $6,031 | $202,840 | $23,040 | $179,800 |
| 2021 | $6,123 | $175,960 | $23,040 | $152,920 |
| 2020 | $6,408 | $171,520 | $23,040 | $148,480 |
| 2019 | $6,408 | $187,480 | $23,040 | $164,440 |
| 2018 | $6,166 | $180,160 | $23,040 | $157,120 |
| 2017 | $5,121 | $159,920 | $20,310 | $139,610 |
| 2016 | $2,369 | $73,840 | $23,040 | $50,800 |
| 2015 | $743 | $23,040 | $23,040 | $0 |
| 2014 | $803 | $16,800 | $0 | $0 |
Source: Public Records
Map
Nearby Homes
- 5 Lake Heron Ct W
- Richmond Plan at Forest Lakes
- Spring Valley II Plan at Forest Lakes
- Pinehurst II Plan at Forest Lakes
- Southport III Plan at Forest Lakes
- Dayton Plan at Forest Lakes
- Spring Willow Plan at Forest Lakes
- Brookhaven Plan at Forest Lakes
- Colleton II Plan at Forest Lakes
- Spring Mountain II Plan at Forest Lakes
- Roxboro Plan at Forest Lakes
- Waverly Plan at Forest Lakes
- Stillwater Plan at Forest Lakes
- Brookline Plan at Forest Lakes
- 304 Forest Lakes Dr
- 193 Champlain Dr
- 183 Champlain Dr
- 198 Champlain Dr
- 192 Champlain Dr
- 188 Champlain Dr