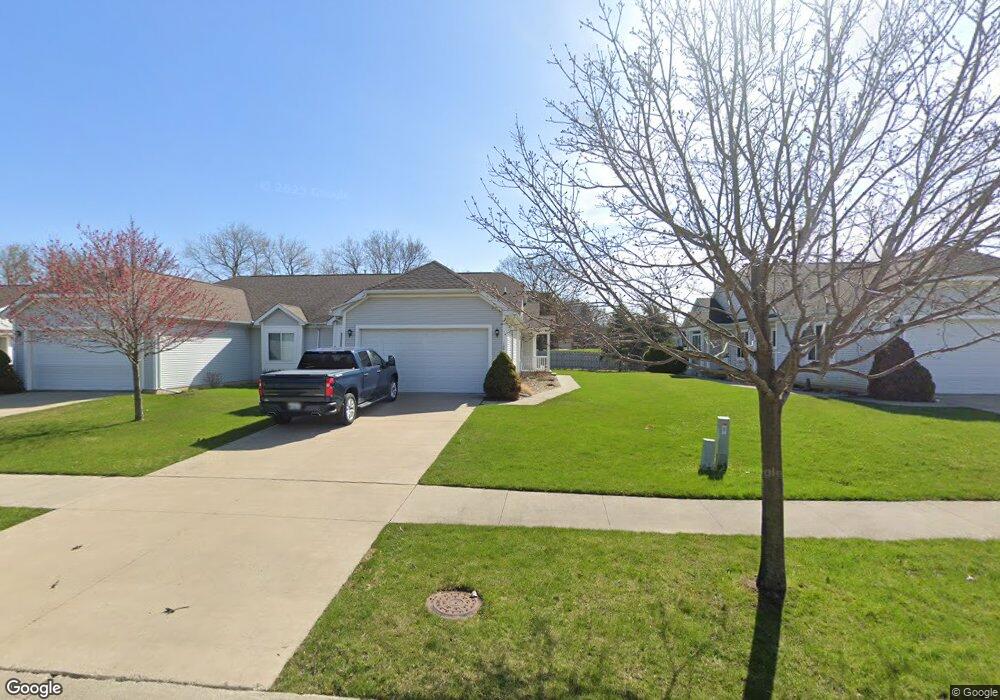
120 Aberdeen Dr Unit 31 Flushing, MI 48433
Estimated Value: $213,476 - $272,000
2
Beds
2
Baths
1,389
Sq Ft
$179/Sq Ft
Est. Value
About This Home
This home is located at 120 Aberdeen Dr Unit 31, Flushing, MI 48433 and is currently estimated at $248,869, approximately $179 per square foot. 120 Aberdeen Dr Unit 31 is a home located in Genesee County with nearby schools including Seymour Elementary School, Flushing Middle School, and Flushing High School.
Ownership History
Date
Name
Owned For
Owner Type
Purchase Details
Closed on
Sep 19, 2024
Sold by
Weber Charles Ross and Weber Cathy Jean
Bought by
Weber Charles Ross and Weber Cathy Jean
Current Estimated Value
Purchase Details
Closed on
Aug 17, 2020
Sold by
Weber Cathy Jean
Bought by
Weber Charles Ross and Weber Cathy Jean
Purchase Details
Closed on
Jul 27, 2020
Sold by
Stone Larry James and Stone Barbara Jean
Bought by
Weber Charles Ross and Weber Cathy Jean
Purchase Details
Closed on
Jul 24, 2020
Sold by
Stone Don William and Stone Marlene Catherine
Bought by
Weber Charles Ross and Weber Cathy Jean
Purchase Details
Closed on
Dec 20, 2016
Sold by
Stonc Marjoric and Stonc Marjoric
Bought by
Stonc Marjoric
Purchase Details
Closed on
Nov 3, 2004
Sold by
Aberdeen Llc
Bought by
Stone Horace and Stone Marjorie
Create a Home Valuation Report for This Property
The Home Valuation Report is an in-depth analysis detailing your home's value as well as a comparison with similar homes in the area
Home Values in the Area
Average Home Value in this Area
Purchase History
| Date | Buyer | Sale Price | Title Company |
|---|---|---|---|
| Weber Charles Ross | -- | None Listed On Document | |
| Weber Charles Ross | -- | None Listed On Document | |
| Weber Charles Ross | -- | None Available | |
| Weber Charles Ross | -- | None Available | |
| Weber Charles Ross | -- | None Available | |
| Stonc Marjoric | -- | None Available | |
| Stone Horace | $160,175 | Centennial Title Co |
Source: Public Records
Tax History
| Year | Tax Paid | Tax Assessment Tax Assessment Total Assessment is a certain percentage of the fair market value that is determined by local assessors to be the total taxable value of land and additions on the property. | Land | Improvement |
|---|---|---|---|---|
| 2025 | $3,139 | $95,800 | $0 | $0 |
| 2024 | $2,547 | $93,000 | $0 | $0 |
| 2023 | $2,451 | $90,900 | $0 | $0 |
| 2022 | $4,749 | $78,400 | $0 | $0 |
| 2021 | $4,749 | $77,200 | $0 | $0 |
| 2020 | $2,155 | $75,100 | $0 | $0 |
| 2019 | $2,125 | $67,400 | $0 | $0 |
| 2018 | $2,515 | $60,600 | $0 | $0 |
| 2017 | $2,357 | $57,700 | $0 | $0 |
| 2016 | $2,338 | $52,284 | $0 | $0 |
| 2015 | $2,328 | $0 | $0 | $0 |
| 2012 | -- | $50,500 | $50,500 | $0 |
Source: Public Records
Map
Nearby Homes
- 241 Aberdeen Ct Unit 11 bldg 6
- 229 Aberdeen Ct
- 100 Aberdeen Dr Unit 36
- 321 Terrace Dr
- 501 Spring Ln
- 0 Winters Eave Dr Unit 50117986
- 6289 W River Rd
- 0 E River Rd Unit 50180952
- 608 Autumn Dr
- 468 Windy Bluff
- 219 Primrose Ln
- 3155 Beech Tree Ln
- 113 N Mckinley Rd
- 3500 Woodridge Ct
- 315 N Maple St
- 516 Sunnyslope Dr
- 314 Myrtle St
- 000 Potter Rd
- 527 Oakbrook Cir Unit 14
- 0 W Pierson Rd Unit 50141989
- 116 Aberdeen Dr Unit 32
- 124 Aberdeen Dr Unit 30
- 128 Aberdeen Dr Unit 29
- 123 Aberdeen Dr
- 248 Aberdeen Ct Unit 21
- 136 Aberdeen Dr Unit 27
- 104 Aberdeen Dr Unit 35
- 244 Aberdeen Ct
- 301 Arthur St
- 131 Aberdeen Dr
- 240 Aberdeen Ct Unit 23
- 140 Aberdeen Dr Unit 26
- 236 Aberdeen Ct
- 507 Lynn St
- 232 Aberdeen Ct
- 135 Aberdeen Dr
- 277 Aberdeen Ct Unit 20
- 273 Aberdeen Ct Unit 19
- 273 Aberdeen Ct Unit 10
- 317 Arthur St
Your Personal Tour Guide
Ask me questions while you tour the home.