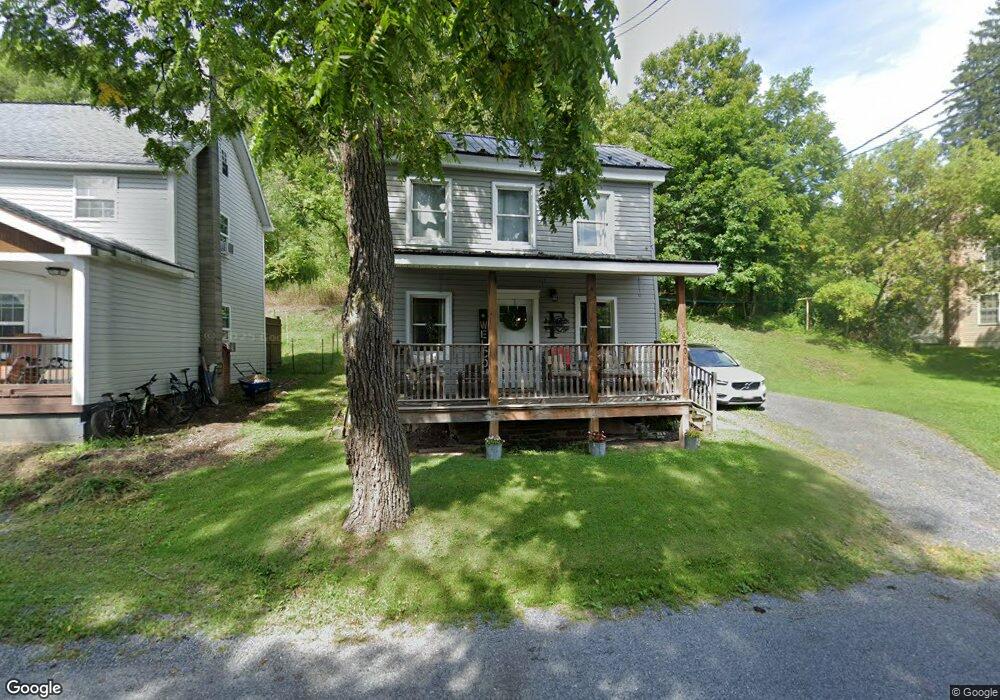
120 Allegheny St Fleming, PA 16835
Estimated Value: $155,000 - $233,000
2
Beds
1
Bath
1,872
Sq Ft
$107/Sq Ft
Est. Value
About This Home
This home is located at 120 Allegheny St, Fleming, PA 16835 and is currently estimated at $199,628, approximately $106 per square foot. 120 Allegheny St is a home.
Ownership History
Date
Name
Owned For
Owner Type
Purchase Details
Closed on
Oct 6, 2005
Sold by
Fisher Travis R and Fisher Tonya M
Bought by
Fisher Travis R
Current Estimated Value
Create a Home Valuation Report for This Property
The Home Valuation Report is an in-depth analysis detailing your home's value as well as a comparison with similar homes in the area
Home Values in the Area
Average Home Value in this Area
Purchase History
| Date | Buyer | Sale Price | Title Company |
|---|---|---|---|
| Fisher Travis R | -- | -- |
Source: Public Records
Tax History Compared to Growth
Tax History
| Year | Tax Paid | Tax Assessment Tax Assessment Total Assessment is a certain percentage of the fair market value that is determined by local assessors to be the total taxable value of land and additions on the property. | Land | Improvement |
|---|---|---|---|---|
| 2025 | $2,229 | $30,095 | $5,000 | $25,095 |
| 2024 | $2,229 | $30,095 | $5,000 | $25,095 |
| 2023 | $2,229 | $30,095 | $5,000 | $25,095 |
| 2022 | $2,170 | $30,095 | $5,000 | $25,095 |
| 2021 | $2,139 | $30,095 | $5,000 | $25,095 |
| 2020 | $2,139 | $30,095 | $5,000 | $25,095 |
| 2019 | $1,265 | $30,095 | $5,000 | $25,095 |
| 2018 | $2,064 | $30,095 | $5,000 | $25,095 |
| 2017 | $2,009 | $30,095 | $5,000 | $25,095 |
| 2016 | -- | $30,095 | $5,000 | $25,095 |
| 2015 | -- | $30,095 | $5,000 | $25,095 |
| 2014 | -- | $30,095 | $5,000 | $25,095 |
Source: Public Records
Map
Nearby Homes
- 341 Main St
- 382 Hawk Ln
- 759 Rattlesnake Pike
- 1221 Valley View Rd
- Beacon Pointe Hometown Plan at Buffalo Run Road
- 1303 Buffalo Run Rd
- 403 Kline Rd
- 241 Abercorn St
- 243 Abercorn St
- 574 Buffalo Run Rd
- 206 Acer Ave
- 204 Acer Ave
- 224 Rock Forge Rd
- Rose Plan at Nittany Glen - Duplex Homes
- Primrose Plan at Nittany Glen - Duplex Homes
- Cypress Plan at Nittany Glen - Duplex Homes
- Willow Duplex Plan at Nittany Glen - Duplex Homes
- 246 Acer Ave
- 211 Abercorn St
- 244 Acer Ave