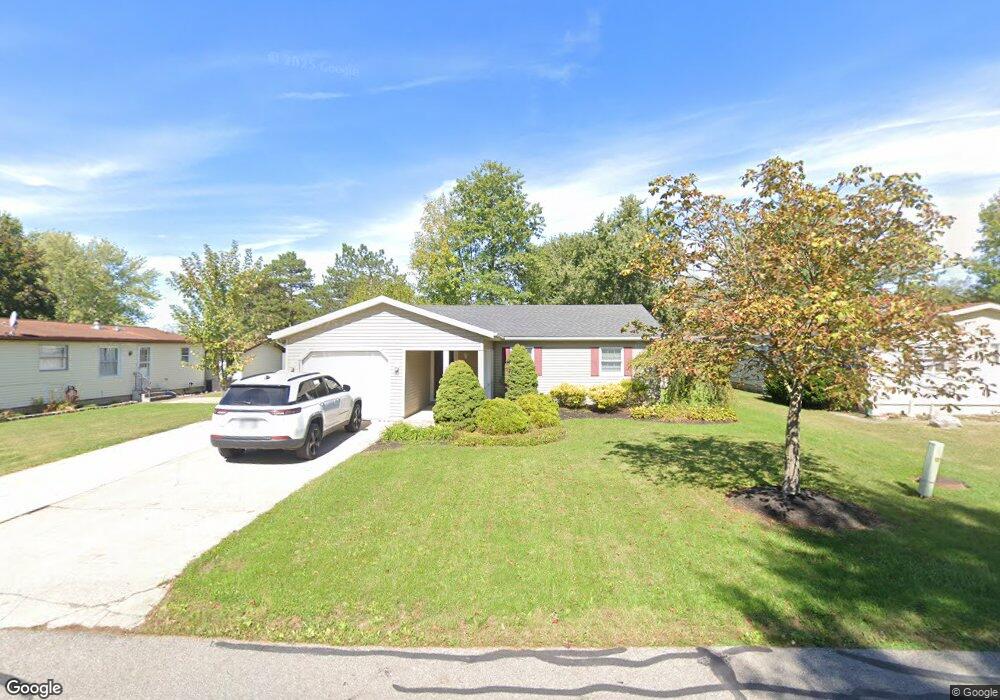
120 Anglers Ln Lagrange, OH 44050
Estimated Value: $126,000 - $158,000
3
Beds
2
Baths
1,140
Sq Ft
$124/Sq Ft
Est. Value
About This Home
This home is located at 120 Anglers Ln, Lagrange, OH 44050 and is currently estimated at $141,516, approximately $124 per square foot. 120 Anglers Ln is a home located in Lorain County with nearby schools including Keystone Elementary School, Keystone Middle School, and Keystone High School.
Ownership History
Date
Name
Owned For
Owner Type
Purchase Details
Closed on
Jul 11, 2006
Sold by
Hud
Bought by
Brewer Christy J
Current Estimated Value
Home Financials for this Owner
Home Financials are based on the most recent Mortgage that was taken out on this home.
Original Mortgage
$67,200
Outstanding Balance
$44,605
Interest Rate
8.9%
Mortgage Type
Purchase Money Mortgage
Estimated Equity
$96,911
Purchase Details
Closed on
Jan 18, 2006
Sold by
Nelsen Joshua R and Nelsen Dana M
Bought by
Hud
Purchase Details
Closed on
Mar 14, 2001
Sold by
Graham Michael P
Bought by
Nelsen Joshua R
Home Financials for this Owner
Home Financials are based on the most recent Mortgage that was taken out on this home.
Original Mortgage
$85,226
Interest Rate
7.13%
Mortgage Type
FHA
Purchase Details
Closed on
Jan 26, 1996
Sold by
Knight Leroy
Bought by
Graham Michael P
Home Financials for this Owner
Home Financials are based on the most recent Mortgage that was taken out on this home.
Original Mortgage
$69,900
Interest Rate
7.19%
Mortgage Type
New Conventional
Create a Home Valuation Report for This Property
The Home Valuation Report is an in-depth analysis detailing your home's value as well as a comparison with similar homes in the area
Home Values in the Area
Average Home Value in this Area
Purchase History
We collect this data history from publicly available records. To have your information removed, we recommend requesting removal directly through your county’s website.
| Date | Buyer | Sale Price | Title Company |
|---|---|---|---|
| Brewer Christy J | $84,000 | Lakeside Title & Escrow Agen | |
| Hud | $65,000 | None Available | |
| Nelsen Joshua R | $85,900 | -- | |
| Graham Michael P | $79,900 | -- |
Source: Public Records
Mortgage History
We collect this data history from publicly available records. To have your information removed, we recommend requesting removal directly through your county’s website.
| Date | Status | Borrower | Loan Amount |
|---|---|---|---|
| Open | Brewer Christy J | $67,200 | |
| Previous Owner | Nelsen Joshua R | $85,226 | |
| Previous Owner | Graham Michael P | $69,900 |
Source: Public Records
Tax History
| Year | Tax Paid | Tax Assessment Tax Assessment Total Assessment is a certain percentage of the fair market value that is determined by local assessors to be the total taxable value of land and additions on the property. | Land | Improvement |
|---|---|---|---|---|
| 2024 | $2,036 | $41,626 | $6,689 | $34,937 |
| 2023 | $1,969 | $33,488 | $6,787 | $26,702 |
| 2022 | $1,956 | $33,488 | $6,787 | $26,702 |
| 2021 | $1,955 | $33,488 | $6,787 | $26,702 |
| 2020 | $1,868 | $28,280 | $5,730 | $22,550 |
| 2019 | $1,858 | $28,280 | $5,730 | $22,550 |
| 2018 | $1,523 | $28,280 | $5,730 | $22,550 |
| 2017 | $1,529 | $26,740 | $4,020 | $22,720 |
| 2016 | $1,517 | $26,740 | $4,020 | $22,720 |
| 2015 | $1,514 | $26,740 | $4,020 | $22,720 |
| 2014 | $1,252 | $25,460 | $3,820 | $21,640 |
| 2013 | $1,213 | $25,460 | $3,820 | $21,640 |
Source: Public Records
Map
Nearby Homes
- 78 Bass Ct
- 46 Perch Ct
- 657 Timber Wolf Ln
- 476 Stallion Ct
- 468 Stallion Ct
- 510 Arabian Ct
- 0 West Rd
- 0 Whitehead Rd
- 18022 State Route 301
- 20290 Indian Hollow Rd
- 110 Railroad St
- 40260 Whitney Rd
- 20935 Indian Hollow Rd
- 422 N Center St
- 40871 Ohio 18
- 516 Appomattox Ct
- 548 William St
- 604 Rundle St
- 608 Rundle St
- 19720 Ohio 58 Unit 24
Your Personal Tour Guide
Ask me questions while you tour the home.