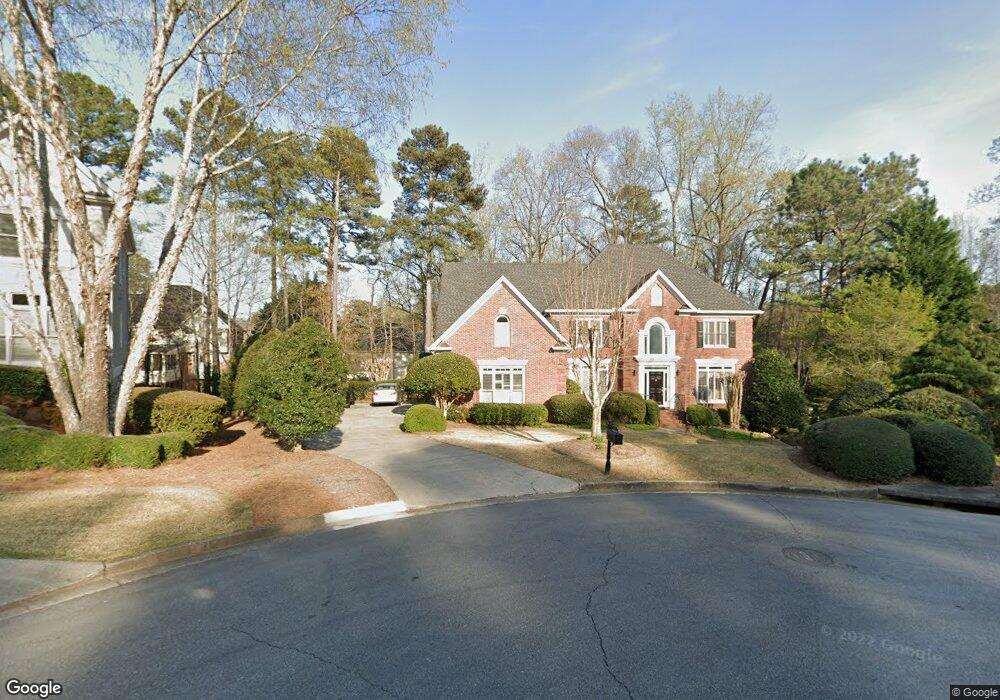
120 Autry Landing Way Unit 5B Alpharetta, GA 30022
Estimated Value: $1,155,000 - $1,358,300
4
Beds
4
Baths
3,974
Sq Ft
$321/Sq Ft
Est. Value
About This Home
This home is located at 120 Autry Landing Way Unit 5B, Alpharetta, GA 30022 and is currently estimated at $1,275,075, approximately $320 per square foot. 120 Autry Landing Way Unit 5B is a home located in Fulton County with nearby schools including Dolvin Elementary School, Autrey Mill Middle School, and Johns Creek High School.
Ownership History
Date
Name
Owned For
Owner Type
Purchase Details
Closed on
Oct 28, 2005
Sold by
Crawford Howard W and Crawford Kathleen G
Bought by
Ullal Rohan S and Ullal Prital H
Current Estimated Value
Home Financials for this Owner
Home Financials are based on the most recent Mortgage that was taken out on this home.
Original Mortgage
$452,000
Outstanding Balance
$245,535
Interest Rate
5.9%
Mortgage Type
New Conventional
Estimated Equity
$1,029,540
Purchase Details
Closed on
Aug 19, 1998
Sold by
Martin Gary and Martin Cynthia M
Bought by
Crawford Howard W
Home Financials for this Owner
Home Financials are based on the most recent Mortgage that was taken out on this home.
Original Mortgage
$377,100
Interest Rate
6.91%
Mortgage Type
New Conventional
Purchase Details
Closed on
Aug 16, 1996
Sold by
Homesinc Jim Hogan
Bought by
Martin Gary
Create a Home Valuation Report for This Property
The Home Valuation Report is an in-depth analysis detailing your home's value as well as a comparison with similar homes in the area
Home Values in the Area
Average Home Value in this Area
Purchase History
| Date | Buyer | Sale Price | Title Company |
|---|---|---|---|
| Ullal Rohan S | $565,000 | -- | |
| Crawford Howard W | $419,000 | -- | |
| Martin Gary | $387,100 | -- |
Source: Public Records
Mortgage History
| Date | Status | Borrower | Loan Amount |
|---|---|---|---|
| Open | Ullal Rohan S | $452,000 | |
| Previous Owner | Crawford Howard W | $377,100 | |
| Closed | Martin Gary | $0 |
Source: Public Records
Tax History Compared to Growth
Tax History
| Year | Tax Paid | Tax Assessment Tax Assessment Total Assessment is a certain percentage of the fair market value that is determined by local assessors to be the total taxable value of land and additions on the property. | Land | Improvement |
|---|---|---|---|---|
| 2025 | $8,328 | $416,760 | $123,480 | $293,280 |
| 2023 | $8,974 | $317,920 | $73,360 | $244,560 |
| 2022 | $7,953 | $317,920 | $73,360 | $244,560 |
| 2021 | $6,745 | $317,920 | $73,360 | $244,560 |
| 2020 | $6,886 | $226,000 | $69,560 | $156,440 |
| 2019 | $838 | $226,000 | $69,560 | $156,440 |
| 2018 | $6,961 | $301,360 | $69,560 | $231,800 |
| 2017 | $7,278 | $226,000 | $49,560 | $176,440 |
| 2016 | $7,165 | $226,000 | $49,560 | $176,440 |
| 2015 | $7,244 | $226,000 | $49,560 | $176,440 |
| 2014 | $7,511 | $226,000 | $49,560 | $176,440 |
Source: Public Records
Map
Nearby Homes
- 3815 Falls Landing Dr
- 2005 Westbourne Way Unit 2
- 350 Waters Bend Way
- 3765 Redcoat Way
- 2001 Tavistock Ct
- 115 Thome Dr
- 515 Oak Bridge Trail
- 545 Oak Bridge Trail
- 10090 Jones Bridge Rd
- 10090 Jones Bridge Rd Unit 8
- 595 Oak Alley Way
- 9715 Almaviva Dr
- 320 Outwood Mill Ct
- 9695 Almaviva Dr
- 510 Winborne Place Unit VI
- 615 S Preston Ct
- 180 Preston Oaks Dr
- 170 Autry Trail
- 9675 Almaviva Dr
- 125 Oak Bridge Ct Unit 2
- 145 Autry Landing Way Unit 5B
- 825 Autry Landing Cir Unit 15
- 110 Autry Landing Way Unit 5B
- 815 Autry Landing Cir
- 135 Autry Landing Way
- 3855 Falls Landing Dr
- 125 Club Falls Dr Unit 5C
- 3865 Falls Landing Dr
- 140 Club Falls Dr
- 0 Autry Landing Way Unit 8566524
- 0 Autry Landing Way Unit 3286012
- 0 Autry Landing Way Unit 8164110
- 0 Autry Landing Way Unit 8173285
- 0 Autry Landing Way Unit 8225534
- 0 Autry Landing Way
- 0 Autry Landing Cir Unit 7359561
- 0 Autry Landing Cir
- 820 Autry Landing Cir
- 3845 Falls Landing Dr
- 125 Autry Landing Way Unit 5B