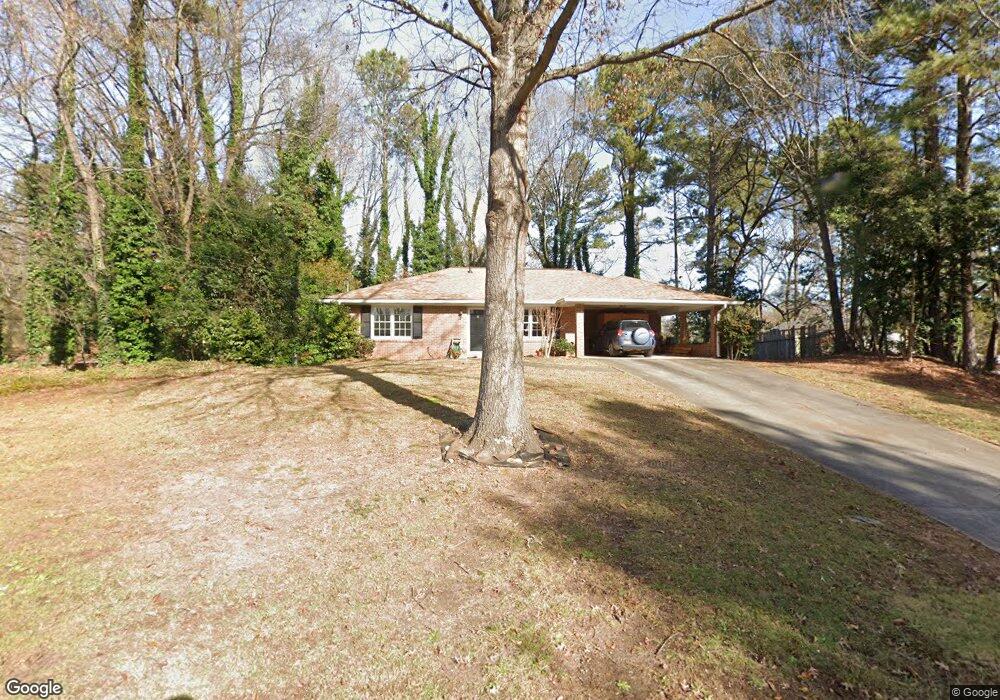
120 Bainbridge Trail Unit 2 Roswell, GA 30076
Estimated Value: $362,000 - $426,844
3
Beds
2
Baths
1,408
Sq Ft
$289/Sq Ft
Est. Value
About This Home
This home is located at 120 Bainbridge Trail Unit 2, Roswell, GA 30076 and is currently estimated at $406,211, approximately $288 per square foot. 120 Bainbridge Trail Unit 2 is a home located in Fulton County with nearby schools including Mimosa Elementary School, Elkins Pointe Middle School, and Roswell High School.
Ownership History
Date
Name
Owned For
Owner Type
Purchase Details
Closed on
Mar 14, 2005
Sold by
Fitzgerald Kathleen S
Bought by
Davis Ronald E
Current Estimated Value
Home Financials for this Owner
Home Financials are based on the most recent Mortgage that was taken out on this home.
Original Mortgage
$140,800
Outstanding Balance
$71,051
Interest Rate
5.54%
Mortgage Type
New Conventional
Estimated Equity
$335,160
Purchase Details
Closed on
Apr 22, 2002
Sold by
Mason Thomas D and Mason Karla P
Bought by
Fitzgerald Kathleen S
Home Financials for this Owner
Home Financials are based on the most recent Mortgage that was taken out on this home.
Original Mortgage
$165,404
Interest Rate
7.07%
Mortgage Type
FHA
Purchase Details
Closed on
Feb 26, 1993
Sold by
Saunders Richard F Sherry
Bought by
Mason Thomas D Karla P
Home Financials for this Owner
Home Financials are based on the most recent Mortgage that was taken out on this home.
Original Mortgage
$85,284
Interest Rate
8.02%
Mortgage Type
FHA
Create a Home Valuation Report for This Property
The Home Valuation Report is an in-depth analysis detailing your home's value as well as a comparison with similar homes in the area
Home Values in the Area
Average Home Value in this Area
Purchase History
| Date | Buyer | Sale Price | Title Company |
|---|---|---|---|
| Davis Ronald E | $176,000 | -- | |
| Fitzgerald Kathleen S | $168,000 | -- | |
| Mason Thomas D Karla P | $92,000 | -- |
Source: Public Records
Mortgage History
| Date | Status | Borrower | Loan Amount |
|---|---|---|---|
| Open | Davis Ronald E | $140,800 | |
| Previous Owner | Fitzgerald Kathleen S | $165,404 | |
| Previous Owner | Mason Thomas D Karla P | $85,284 |
Source: Public Records
Tax History Compared to Growth
Tax History
| Year | Tax Paid | Tax Assessment Tax Assessment Total Assessment is a certain percentage of the fair market value that is determined by local assessors to be the total taxable value of land and additions on the property. | Land | Improvement |
|---|---|---|---|---|
| 2025 | $307 | $136,000 | $33,480 | $102,520 |
| 2023 | $4,087 | $136,000 | $33,480 | $102,520 |
| 2022 | $926 | $114,760 | $33,880 | $80,880 |
| 2021 | $1,107 | $105,680 | $29,000 | $76,680 |
| 2020 | $1,119 | $100,560 | $27,600 | $72,960 |
| 2019 | $206 | $109,320 | $26,520 | $82,800 |
| 2018 | $1,592 | $99,440 | $35,720 | $63,720 |
| 2017 | $883 | $57,600 | $15,960 | $41,640 |
| 2016 | $880 | $57,600 | $15,960 | $41,640 |
| 2015 | $1,084 | $57,600 | $15,960 | $41,640 |
| 2014 | $881 | $57,600 | $15,960 | $41,640 |
Source: Public Records
Map
Nearby Homes
- 1675 Bainbridge Way
- 155 Willow Stream Ct
- 163 Willow Stream Ct
- 146 Willow Stream Ct
- 10016 Jack Dr
- 3009 Park Ave
- 1007 Belle Ave
- 1130 Worthington Hills Dr
- 420 Old Holcomb Bridge Rd
- 425 Worthington Hills Ct
- 10630 Worthington Hills Manor
- 810 Kenway Ave
- 525 Ashbury Dr
- 355 Walker Ave
- 320 Walker Ave
- 1110 Harper Dr
- 110 Roswell Commons Way
- 223 High Creek Dr Unit 3A
- 9925 La View Cir
- 260 Mansell Cir
- 130 Bainbridge Trail
- 1525 Bainbridge Ln
- 1535 Bainbridge Ln Unit 1
- 1610 Bainbridge Way
- 140 Bainbridge Trail Unit 2
- 125 Bainbridge Trail
- 135 Bainbridge Trail
- 1545 Bainbridge Ln
- 115 Bainbridge Trail
- 145 Bainbridge Trail
- N Bainbridge Ln
- 1620 Bainbridge Way
- 105 Bainbridge Trail
- 155 Bainbridge Trail
- 150 Bainbridge Trail
- 1530 Bainbridge Ln
- 1520 Bainbridge Ln
- 1630 Bainbridge Way
- 1540 Bainbridge Ln
- 165 Bainbridge Trail