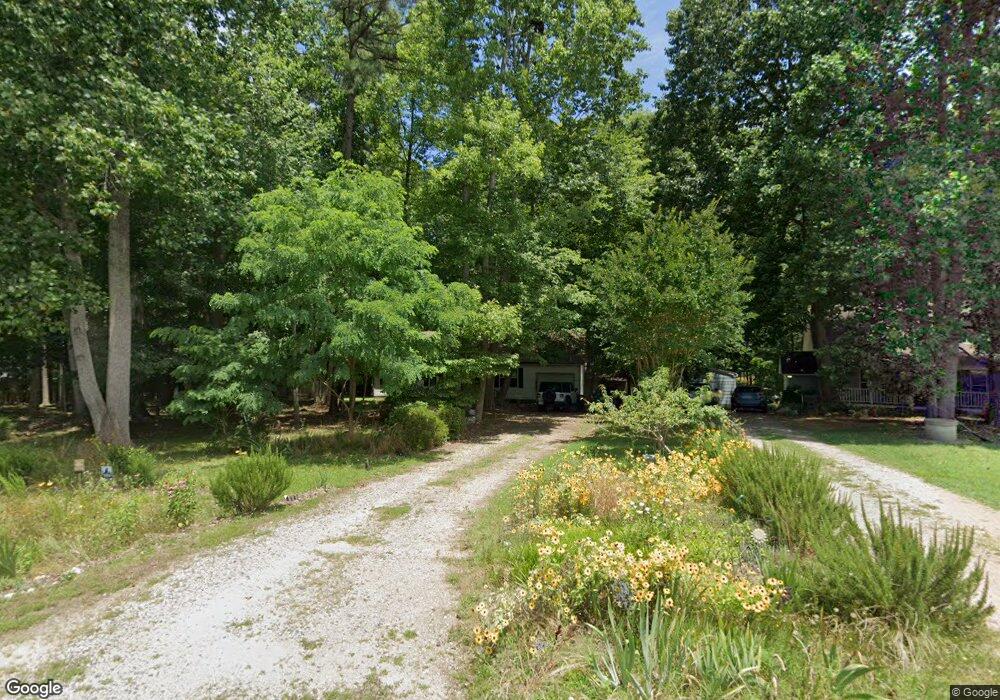
120 Bridges Ln Youngsville, NC 27596
Estimated Value: $246,000 - $284,000
3
Beds
2
Baths
1,050
Sq Ft
$253/Sq Ft
Est. Value
About This Home
This home is located at 120 Bridges Ln, Youngsville, NC 27596 and is currently estimated at $265,695, approximately $253 per square foot. 120 Bridges Ln is a home located in Franklin County with nearby schools including Long Mill Elementary, Cedar Creek Middle, and Franklinton High School.
Ownership History
Date
Name
Owned For
Owner Type
Purchase Details
Closed on
Jan 17, 2018
Sold by
Timper Virginia E
Bought by
Dominguez Jacqueline Cuda
Current Estimated Value
Home Financials for this Owner
Home Financials are based on the most recent Mortgage that was taken out on this home.
Original Mortgage
$135,800
Outstanding Balance
$114,599
Interest Rate
3.94%
Mortgage Type
New Conventional
Estimated Equity
$151,096
Purchase Details
Closed on
Feb 13, 2017
Sold by
120 Bridges Lane Llc
Bought by
Timper Virginia E
Home Financials for this Owner
Home Financials are based on the most recent Mortgage that was taken out on this home.
Original Mortgage
$128,282
Interest Rate
4.12%
Mortgage Type
New Conventional
Purchase Details
Closed on
Jan 25, 2010
Sold by
Stambaugh Charlene R
Bought by
120 Bridges Lane Llc
Purchase Details
Closed on
Feb 25, 2005
Sold by
Jp Morgan Chase Bank
Bought by
Stambaugh Charlene R
Create a Home Valuation Report for This Property
The Home Valuation Report is an in-depth analysis detailing your home's value as well as a comparison with similar homes in the area
Home Values in the Area
Average Home Value in this Area
Purchase History
| Date | Buyer | Sale Price | Title Company |
|---|---|---|---|
| Dominguez Jacqueline Cuda | $140,000 | None Available | |
| Timper Virginia E | $127,000 | Attorney | |
| 120 Bridges Lane Llc | -- | None Available | |
| Stambaugh Charlene R | $75,000 | None Available |
Source: Public Records
Mortgage History
| Date | Status | Borrower | Loan Amount |
|---|---|---|---|
| Open | Dominguez Jacqueline Cuda | $135,800 | |
| Previous Owner | Timper Virginia E | $128,282 |
Source: Public Records
Tax History Compared to Growth
Tax History
| Year | Tax Paid | Tax Assessment Tax Assessment Total Assessment is a certain percentage of the fair market value that is determined by local assessors to be the total taxable value of land and additions on the property. | Land | Improvement |
|---|---|---|---|---|
| 2024 | $1,531 | $239,650 | $68,250 | $171,400 |
| 2023 | $1,342 | $139,940 | $30,000 | $109,940 |
| 2022 | $1,332 | $139,940 | $30,000 | $109,940 |
| 2021 | $1,338 | $139,940 | $30,000 | $109,940 |
| 2020 | $1,346 | $139,940 | $30,000 | $109,940 |
| 2019 | $1,336 | $139,940 | $30,000 | $109,940 |
| 2018 | $1,324 | $139,940 | $30,000 | $109,940 |
| 2017 | $1,048 | $99,310 | $30,000 | $69,310 |
| 2016 | $1,083 | $99,310 | $30,000 | $69,310 |
| 2015 | $1,083 | $99,310 | $30,000 | $69,310 |
| 2014 | $1,006 | $99,310 | $30,000 | $69,310 |
Source: Public Records
Map
Nearby Homes
- 195 Eagle Stone Ridge
- 105 Hines Ct
- 65 Beaver Ridge Dr
- 325 Paddy Ln
- 109 Shearin Ct
- 20 James Joyce Ct
- 40 Oscar Wilde Way
- 96 Madeline Ct
- 108 Madeline Ct
- 132 Waiters Way
- 25 Paddy Ln
- 101 New Castle Ct
- 146 Clark Ct
- 1045 Peony Ln
- 1047 Peony Ln
- 1043 Peony Ln
- 1027 Peony Ln
- Amelia Plan at Hidden Lake - The Enclave at - 55+ Community
- Mayfair Plan at Hidden Lake - The Enclave at - 55+ Community
- Millbrook Plan at Hidden Lake - The Enclave at - 55+ Community
- 116 Bridges Ln
- 124 Bridges Ln
- 112 Bridges Ln
- 128 Bridges Ln
- 117 Bridges Ln
- 113 Bridges Ln
- 125 Bridges Ln
- 105 Eason Ct
- 132 Bridges Ln
- 175 Eaglestone
- 175 Eagle Stone Ridge
- 155 Eaglestone
- 155 Eagle Stone Ridge
- 100 Eason Ct
- 105 Bridges Ln
- 185 Eaglestone
- 185 Eagle Stone Ridge
- 109 Eason Ct
- 145 Eaglestone
- 145 Eagle Stone Ridge