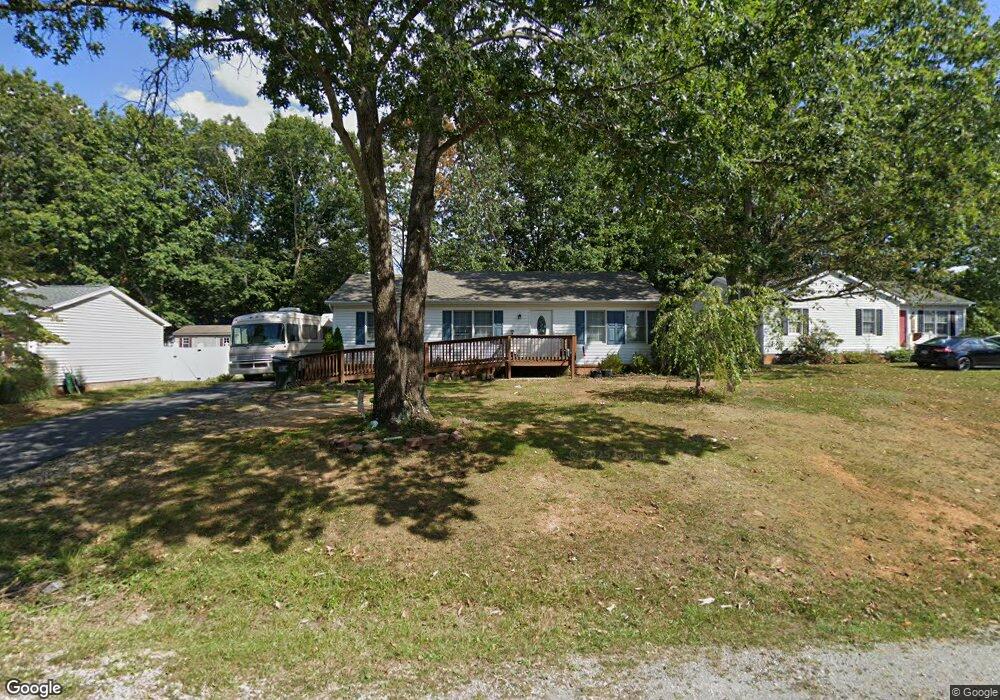
120 Brookmill Rd Stuarts Draft, VA 24477
Estimated Value: $266,000 - $274,000
3
Beds
2
Baths
1,120
Sq Ft
$242/Sq Ft
Est. Value
About This Home
This home is located at 120 Brookmill Rd, Stuarts Draft, VA 24477 and is currently estimated at $271,256, approximately $242 per square foot. 120 Brookmill Rd is a home located in Augusta County with nearby schools including Stuarts Draft Elementary School, Stuarts Draft Middle School, and Stuarts Draft High School.
Ownership History
Date
Name
Owned For
Owner Type
Purchase Details
Closed on
Mar 5, 2019
Sold by
Equist T Co
Bought by
Moore Lamara A
Current Estimated Value
Home Financials for this Owner
Home Financials are based on the most recent Mortgage that was taken out on this home.
Original Mortgage
$151,320
Outstanding Balance
$131,950
Interest Rate
4.4%
Mortgage Type
Purchase Money Mortgage
Estimated Equity
$139,306
Purchase Details
Closed on
Sep 21, 2017
Sold by
Wells Fargo Bank Na
Bought by
Military Warriors Support Foundation
Purchase Details
Closed on
Sep 6, 2012
Sold by
George Troy A and George Lisa R
Bought by
Allen Jennifer R
Home Financials for this Owner
Home Financials are based on the most recent Mortgage that was taken out on this home.
Original Mortgage
$147,959
Interest Rate
3.57%
Mortgage Type
New Conventional
Create a Home Valuation Report for This Property
The Home Valuation Report is an in-depth analysis detailing your home's value as well as a comparison with similar homes in the area
Purchase History
| Date | Buyer | Sale Price | Title Company |
|---|---|---|---|
| Moore Lamara A | $156,000 | -- | |
| Military Warriors Support Foundation | $134,700 | Boston National Title | |
| Allen Jennifer R | $145,000 | Attorney |
Source: Public Records
Mortgage History
| Date | Status | Borrower | Loan Amount |
|---|---|---|---|
| Open | Moore Lamara A | $151,320 | |
| Previous Owner | Allen Jennifer R | $147,959 |
Source: Public Records
Tax History
| Year | Tax Paid | Tax Assessment Tax Assessment Total Assessment is a certain percentage of the fair market value that is determined by local assessors to be the total taxable value of land and additions on the property. | Land | Improvement |
|---|---|---|---|---|
| 2025 | $1,171 | $225,200 | $55,000 | $170,200 |
| 2024 | $1,187 | $228,300 | $55,000 | $173,300 |
| 2023 | $918 | $145,700 | $50,000 | $95,700 |
| 2022 | $918 | $145,700 | $50,000 | $95,700 |
| 2021 | $918 | $145,700 | $50,000 | $95,700 |
| 2020 | $918 | $145,700 | $50,000 | $95,700 |
| 2019 | $918 | $145,700 | $50,000 | $95,700 |
| 2018 | $849 | $134,742 | $50,000 | $84,742 |
| 2017 | $781 | $134,742 | $50,000 | $84,742 |
| 2016 | $781 | $134,742 | $50,000 | $84,742 |
| 2015 | $657 | $134,742 | $50,000 | $84,742 |
| 2014 | $657 | $134,742 | $50,000 | $84,742 |
| 2013 | $657 | $136,800 | $55,000 | $81,800 |
Source: Public Records
Map
Nearby Homes
- 117 Spring Ridge Dr
- 114 Jaspers Ln
- 92 Rankin Ln
- 514 Lipscomb Rd
- 00 Lyndhurst Rd
- 1655 Howardsville Turnpike
- 00 Lipscomb Rd
- 19 Mathews Ln
- 1325 Mt Torrey Rd
- 1932 Howardsville Turnpike
- 1059 Mt Torrey Rd
- 363 Wayne Ave
- 001 Mount Torrey Rd
- 28 Flint Mountain Dr
- 252 Flint Mountain Dr
- 43 Dogwood Rd
- 87 Falling Rock Dr
- 36 Skyline Ave
- 162 Locust Grove Ln
- 124 Forest Springs Dr
- 116 Brookmill Rd
- 126 Brookmill Rd
- 3 Canton Ln
- 4 Canton Ln
- 108 Brookmill Rd
- 128 Brookmill Rd
- 117 Brookmill Rd
- 123 Brookmill Rd
- 111 Brookmill Rd
- 5 Canton Ln
- 104 Brookmill Rd
- 125 Brookmill Rd
- 105 Brookmill Rd
- 127 Brookmill Rd
- 13 Kingston Ct
- 940 Patton Farm Rd
- 938 Patton Farm Rd
- 9 Canton Ln
- 1 Kingston Ct
- 932 Patton Farm Rd
Your Personal Tour Guide
Ask me questions while you tour the home.