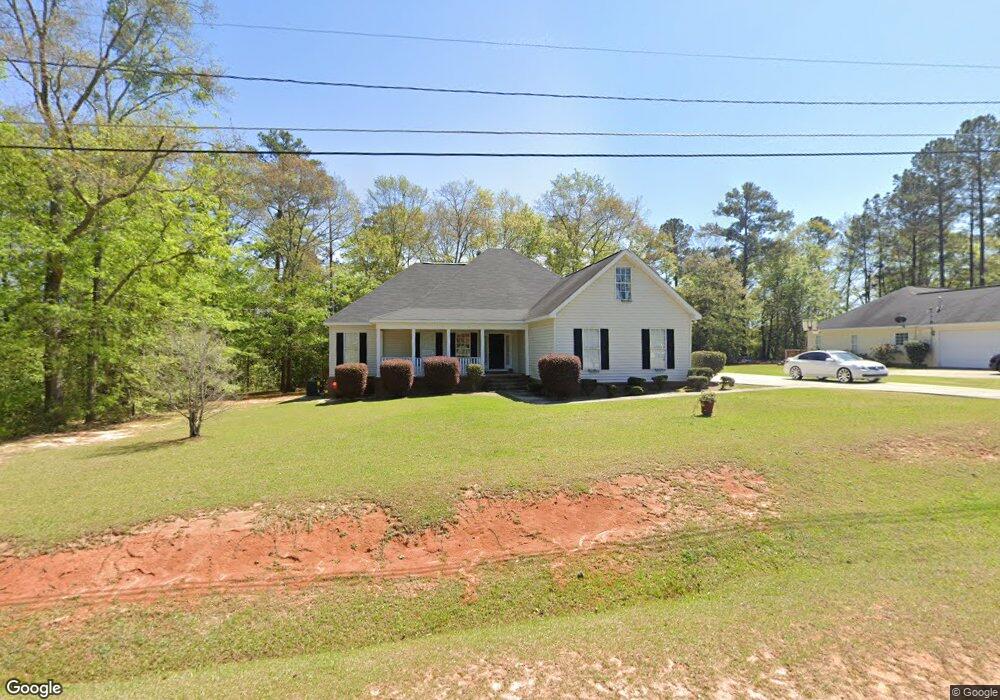
120 Browning Point Rd Macon, GA 31216
Estimated Value: $272,560 - $319,000
3
Beds
2
Baths
2,137
Sq Ft
$136/Sq Ft
Est. Value
About This Home
This home is located at 120 Browning Point Rd, Macon, GA 31216 and is currently estimated at $290,640, approximately $136 per square foot. 120 Browning Point Rd is a home located in Bibb County with nearby schools including Porter Elementary School, Rutland Middle School, and Rutland High School.
Ownership History
Date
Name
Owned For
Owner Type
Purchase Details
Closed on
Oct 13, 2023
Sold by
Billingslea Karmen
Bought by
Harvey Cynthia and Harvey Quintreus
Current Estimated Value
Home Financials for this Owner
Home Financials are based on the most recent Mortgage that was taken out on this home.
Original Mortgage
$250,381
Outstanding Balance
$245,286
Interest Rate
7.18%
Mortgage Type
FHA
Estimated Equity
$45,354
Purchase Details
Closed on
Nov 28, 2016
Sold by
Tracy
Bought by
Billingslea Karmen
Purchase Details
Closed on
Sep 19, 2005
Bought by
Billingslea Karmen and Billingslea Tracy V
Home Financials for this Owner
Home Financials are based on the most recent Mortgage that was taken out on this home.
Original Mortgage
$131,920
Interest Rate
7.65%
Mortgage Type
Adjustable Rate Mortgage/ARM
Purchase Details
Closed on
Jun 9, 2005
Sold by
Crumpton Darrell and Crumpton India
Bought by
Wright Building Co Llc
Purchase Details
Closed on
Apr 15, 2004
Purchase Details
Closed on
Aug 21, 2003
Create a Home Valuation Report for This Property
The Home Valuation Report is an in-depth analysis detailing your home's value as well as a comparison with similar homes in the area
Purchase History
We collect this data history from publicly available records. To have your information removed, we recommend requesting removal directly through your county’s website.
| Date | Buyer | Sale Price | Title Company |
|---|---|---|---|
| Harvey Cynthia | $255,000 | None Listed On Document | |
| Billingslea Karmen | -- | -- | |
| Billingslea Karmen | $164,900 | -- | |
| Wright Building Co Llc | $175,000 | None Available | |
| -- | $159,900 | -- | |
| -- | $22,000 | -- |
Source: Public Records
Mortgage History
We collect this data history from publicly available records. To have your information removed, we recommend requesting removal directly through your county’s website.
| Date | Status | Borrower | Loan Amount |
|---|---|---|---|
| Open | Harvey Cynthia | $250,381 | |
| Previous Owner | Billingslea Karmen | $131,920 | |
| Previous Owner | Billingslea Karmen | $32,980 |
Source: Public Records
Tax History
| Year | Tax Paid | Tax Assessment Tax Assessment Total Assessment is a certain percentage of the fair market value that is determined by local assessors to be the total taxable value of land and additions on the property. | Land | Improvement |
|---|---|---|---|---|
| 2025 | $2,348 | $102,533 | $18,000 | $84,533 |
| 2024 | $2,413 | $102,533 | $18,000 | $84,533 |
| 2023 | $2,025 | $79,746 | $8,000 | $71,746 |
| 2022 | $2,591 | $74,844 | $10,800 | $64,044 |
| 2021 | $2,844 | $74,844 | $10,800 | $64,044 |
| 2020 | $2,906 | $74,844 | $10,800 | $64,044 |
| 2019 | $2,930 | $74,844 | $10,800 | $64,044 |
| 2018 | $4,667 | $74,844 | $10,800 | $64,044 |
| 2017 | $2,804 | $74,844 | $10,800 | $64,044 |
| 2016 | $2,377 | $68,692 | $10,800 | $57,892 |
| 2015 | $3,364 | $68,692 | $10,800 | $57,892 |
| 2014 | $3,369 | $68,692 | $10,800 | $57,892 |
Source: Public Records
Map
Nearby Homes
- 2813 S Estates Rd
- 3038 Debra Ann Dr
- 297 Amanda Dr
- 515 Amanda Way
- 3036 Marie Cir
- 5402 Houston Rd
- 3285 Hartley Bridge Rd
- 201 Liberty Trace
- 3290 Bridgewood Dr
- 6266 Houston Rd
- 308 Ellis Ct
- 2154 Allen Rd
- 3294 Bridgewood Dr
- 3533 Bridgewood Dr
- 3150 Holleman Dr
- 6629 Hawkinsville Rd
- 109 Oakview Club Dr
- 6414 Ponderosa Dr
- 3491 Sandy Cir
- 361 Eagle Ridge Rd Unit LOT 13
- 202 Browning Point Rd
- 202 Browning Pointe Rd
- 6055 Taylor Dr
- 105 Jamic Ct
- 208 Browning Point Rd
- 100 Jamic Ct
- 100 Jamic Ct Unit 34
- 115 Browning Pointe Rd
- 109 Jamic Ct
- 111 Browning Point Rd
- 111 Browning Pointe Rd
- 101 Fred Ct
- 2660 Allen Rd
- 212 Browning Point Rd
- 111 Jamic Ct
- 108 Jamic Ct
- 2640 Allen Rd
- 107 Fred Ct
- 104 Browning Point Rd
- 6075 Taylor Dr
Your Personal Tour Guide
Ask me questions while you tour the home.