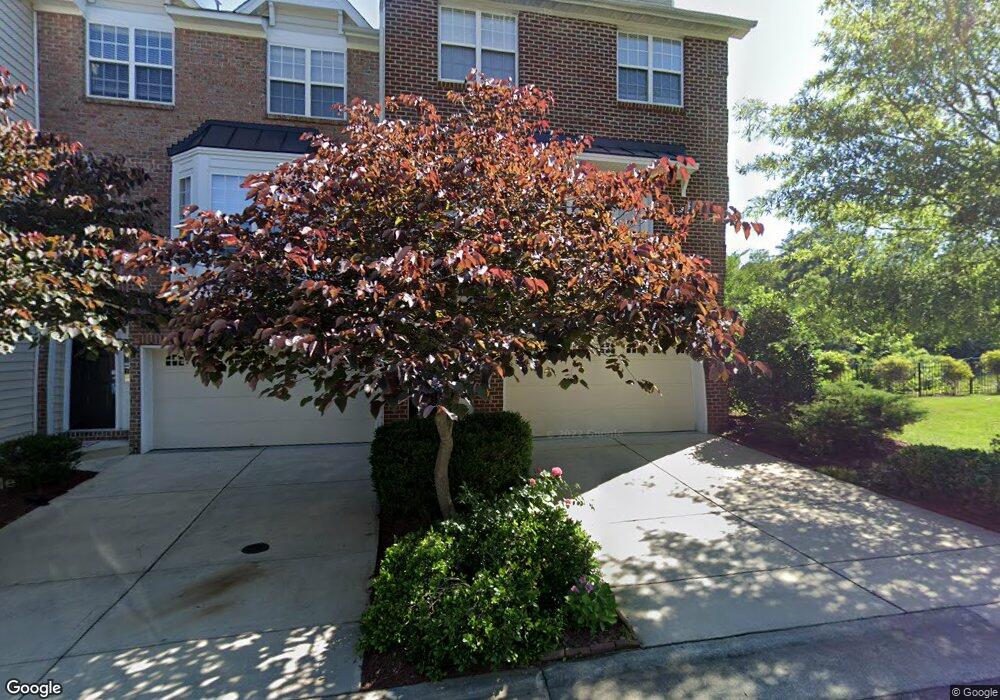
120 Cabernet Dr Chapel Hill, NC 27516
Estimated Value: $468,969 - $529,000
3
Beds
4
Baths
2,121
Sq Ft
$236/Sq Ft
Est. Value
About This Home
This home is located at 120 Cabernet Dr, Chapel Hill, NC 27516 and is currently estimated at $501,492, approximately $236 per square foot. 120 Cabernet Dr is a home located in Orange County with nearby schools including Seawell Elementary School, Smith Middle School, and Chapel Hill High School.
Ownership History
Date
Name
Owned For
Owner Type
Purchase Details
Closed on
Oct 15, 2010
Sold by
Tong Bert
Bought by
Choi Jin Jae and Choi Kung Hee
Current Estimated Value
Home Financials for this Owner
Home Financials are based on the most recent Mortgage that was taken out on this home.
Original Mortgage
$200,000
Outstanding Balance
$132,247
Interest Rate
4.39%
Mortgage Type
New Conventional
Estimated Equity
$369,245
Purchase Details
Closed on
Apr 25, 2006
Sold by
He Kuang Lin and Wang Kai Fen
Bought by
Tong Bert
Home Financials for this Owner
Home Financials are based on the most recent Mortgage that was taken out on this home.
Original Mortgage
$167,000
Interest Rate
5.87%
Mortgage Type
Purchase Money Mortgage
Purchase Details
Closed on
Aug 11, 2004
Sold by
Centex Homes
Bought by
He Kuang Lin and Wang Kai Fen
Home Financials for this Owner
Home Financials are based on the most recent Mortgage that was taken out on this home.
Original Mortgage
$204,360
Interest Rate
6.19%
Mortgage Type
Fannie Mae Freddie Mac
Create a Home Valuation Report for This Property
The Home Valuation Report is an in-depth analysis detailing your home's value as well as a comparison with similar homes in the area
Home Values in the Area
Average Home Value in this Area
Purchase History
| Date | Buyer | Sale Price | Title Company |
|---|---|---|---|
| Choi Jin Jae | $270,000 | None Available | |
| Tong Bert | $291,500 | None Available | |
| He Kuang Lin | $255,500 | -- |
Source: Public Records
Mortgage History
| Date | Status | Borrower | Loan Amount |
|---|---|---|---|
| Open | Choi Jin Jae | $200,000 | |
| Previous Owner | Tong Bert | $167,000 | |
| Previous Owner | He Kuang Lin | $204,360 | |
| Closed | He Kuang Lin | $25,545 |
Source: Public Records
Tax History Compared to Growth
Tax History
| Year | Tax Paid | Tax Assessment Tax Assessment Total Assessment is a certain percentage of the fair market value that is determined by local assessors to be the total taxable value of land and additions on the property. | Land | Improvement |
|---|---|---|---|---|
| 2025 | $5,958 | $447,400 | $150,000 | $297,400 |
| 2024 | $5,309 | $309,400 | $80,000 | $229,400 |
| 2023 | $5,166 | $309,400 | $80,000 | $229,400 |
| 2022 | $4,952 | $309,400 | $80,000 | $229,400 |
| 2021 | $4,889 | $309,400 | $80,000 | $229,400 |
| 2020 | $4,848 | $288,100 | $80,000 | $208,100 |
| 2018 | $4,737 | $288,100 | $80,000 | $208,100 |
| 2017 | $4,408 | $288,100 | $80,000 | $208,100 |
| 2016 | $4,408 | $264,399 | $30,267 | $234,132 |
| 2015 | $4,408 | $264,399 | $30,267 | $234,132 |
| 2014 | $4,365 | $264,399 | $30,267 | $234,132 |
Source: Public Records
Map
Nearby Homes
- 117 Gamay Dr
- 115 Gamey Dr
- 115 Gamay Dr
- 132 Malbec Dr
- 300 Christine Ct
- 101 Gamay Dr
- 124 Malbec Dr
- 124 Malbec Way
- 103 Golden Gate Ln
- 105 Golden Gate Ln
- 114 Malbec Dr
- Plan 1913 Modeled at Bridgepoint
- Plan 1731 Modeled at Bridgepoint
- Plan 1566 Modeled at Bridgepoint
- 104 Malbec Dr
- 104 Malbec Way
- 128 Pinnacle Dr
- 427 New Parkside Dr
- Astor Plan at Summit At Homestead
- Onslow Plan at Summit At Homestead
- 122 Cabernet Dr
- 124 Cabernet Dr
- 126 Cabernet Dr
- 128 Cabernet Dr
- 136 Cabernet Dr
- 117 Cabernet Dr
- 113 Cabernet Dr
- 115 Cabernet Dr
- 118 Cabernet Dr
- 111 Cabernet Dr
- 116 Cabernet Dr
- 100 Vintage Dr
- 112 Cabernet Dr
- 114 Cabernet Dr
- 102 Vintage Dr
- 109 Cabernet Dr
- 107 Cabernet Dr
- 111 Vintage Dr
- 111 Vintage Dr
- 104 Vintage Dr