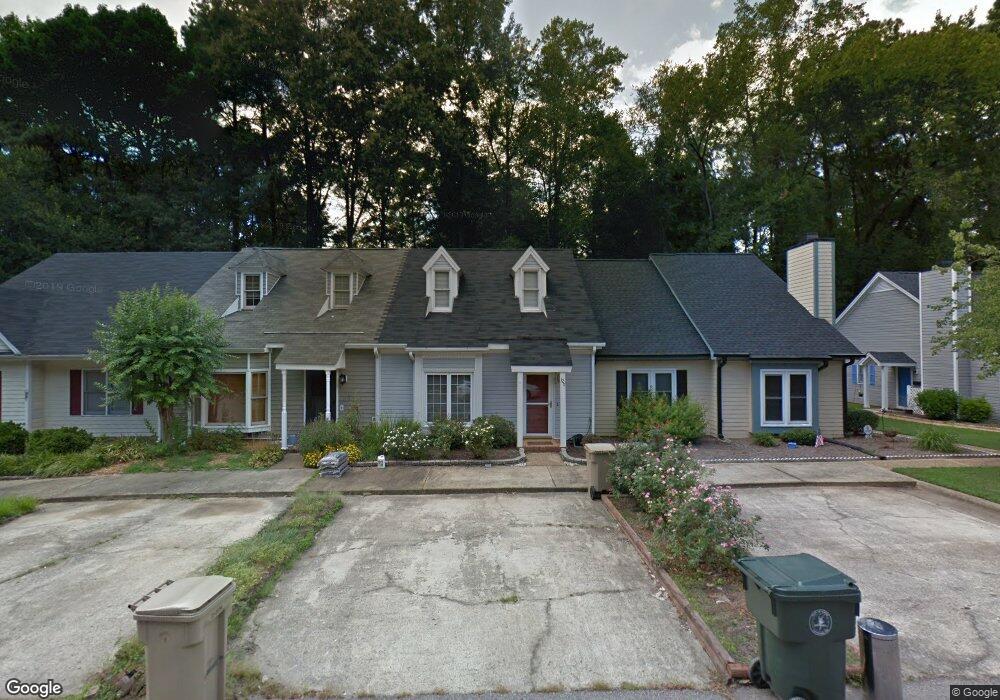
120 Carriage House Trail Garner, NC 27529
Estimated Value: $257,000 - $289,000
3
Beds
2
Baths
1,424
Sq Ft
$189/Sq Ft
Est. Value
About This Home
This home is located at 120 Carriage House Trail, Garner, NC 27529 and is currently estimated at $269,784, approximately $189 per square foot. 120 Carriage House Trail is a home located in Wake County with nearby schools including Aversboro Elementary, East Garner Middle School, and Garner High.
Ownership History
Date
Name
Owned For
Owner Type
Purchase Details
Closed on
Apr 20, 2010
Sold by
Shaffer Stephanie Moody and Shaffer Matthew Donald
Bought by
Mason Christine L
Current Estimated Value
Home Financials for this Owner
Home Financials are based on the most recent Mortgage that was taken out on this home.
Original Mortgage
$114,000
Outstanding Balance
$76,003
Interest Rate
5.02%
Mortgage Type
New Conventional
Estimated Equity
$193,781
Purchase Details
Closed on
Jan 8, 2007
Sold by
Bank Of New York
Bought by
Moody Stephanie
Home Financials for this Owner
Home Financials are based on the most recent Mortgage that was taken out on this home.
Original Mortgage
$74,000
Interest Rate
6.08%
Mortgage Type
Unknown
Purchase Details
Closed on
Sep 21, 2006
Sold by
Booker Frances V
Bought by
Bank Of New York and Certificate Holders Of Cwabs 2004-06
Create a Home Valuation Report for This Property
The Home Valuation Report is an in-depth analysis detailing your home's value as well as a comparison with similar homes in the area
Home Values in the Area
Average Home Value in this Area
Purchase History
| Date | Buyer | Sale Price | Title Company |
|---|---|---|---|
| Mason Christine L | $114,000 | None Available | |
| Moody Stephanie | $92,500 | None Available | |
| Bank Of New York | $102,236 | None Available |
Source: Public Records
Mortgage History
| Date | Status | Borrower | Loan Amount |
|---|---|---|---|
| Open | Mason Christine L | $114,000 | |
| Previous Owner | Moody Stephanie | $74,000 |
Source: Public Records
Tax History Compared to Growth
Tax History
| Year | Tax Paid | Tax Assessment Tax Assessment Total Assessment is a certain percentage of the fair market value that is determined by local assessors to be the total taxable value of land and additions on the property. | Land | Improvement |
|---|---|---|---|---|
| 2025 | -- | $264,486 | $90,000 | $174,486 |
| 2024 | $2,753 | $264,486 | $90,000 | $174,486 |
| 2023 | $2,034 | $156,892 | $35,000 | $121,892 |
| 2022 | $1,858 | $156,892 | $35,000 | $121,892 |
| 2021 | $1,765 | $156,892 | $35,000 | $121,892 |
| 2020 | $1,741 | $156,892 | $35,000 | $121,892 |
| 2019 | $1,515 | $116,719 | $24,000 | $92,719 |
| 2018 | $1,405 | $116,719 | $24,000 | $92,719 |
| 2017 | $1,359 | $116,719 | $24,000 | $92,719 |
| 2016 | $1,342 | $116,719 | $24,000 | $92,719 |
| 2015 | $1,300 | $113,101 | $20,000 | $93,101 |
| 2014 | $1,239 | $113,101 | $20,000 | $93,101 |
Source: Public Records
Map
Nearby Homes
- 132 Carriage House Trail
- 106 Argyle Ct
- 118 Rhum Place
- 1200 Poole Dr
- 113 Heatherwood Dr
- 1308 Claymore Dr
- 201 Gulley Glen Dr
- 166 Gulley Glen Dr
- 119 Bayleigh Ct
- 102 Castill Place
- 100 Sheraton Ln
- 126 Gulley Glen Dr
- 1101 Park Ave
- 107 Coachman Dr
- 1607 Sycamore Dr
- 145 Mariah Towns Way
- 215 Mariah Towns Way
- 107 Binford Ct
- 211 Kineton Woods Way
- 349 Kineton Woods Way
- 122 Carriage House Trail
- 124 Carriage House Trail
- 118 Carriage House Trail
- 126 Carriage House Trail
- 116 Carriage House Trail
- 128 Carriage House Trail
- 130 Carriage House Trail
- 114 Carriage House Trail
- 112 Carriage House Trail
- 151 Carriage House Trail
- 110 Carriage House Trail
- 117 Carriage House Trail
- 134 Carriage House Trail
- 115 Carriage House Trail
- 113 Carriage House Trail
- 108 Carriage House Trail
- 111 Carriage House Trail
- 905 Buckingham Rd
- 903 Buckingham Rd
- 907 Buckingham Rd