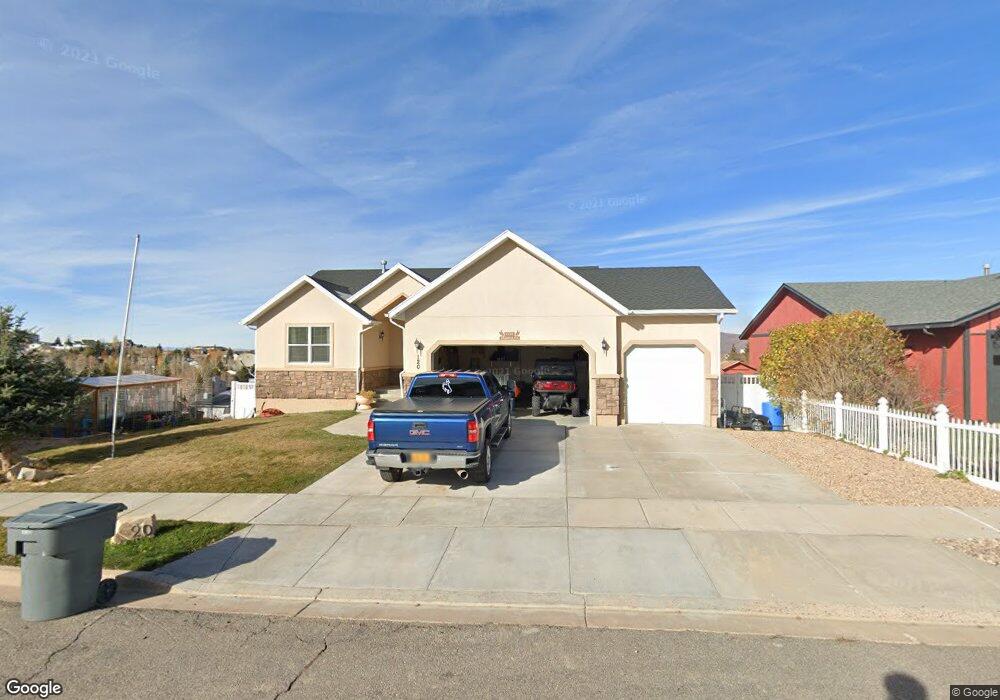
120 Chandler Ln Evanston, WY 82930
Estimated Value: $453,000 - $617,000
4
Beds
3
Baths
1,515
Sq Ft
$333/Sq Ft
Est. Value
About This Home
This home is located at 120 Chandler Ln, Evanston, WY 82930 and is currently estimated at $504,614, approximately $333 per square foot. 120 Chandler Ln is a home located in Uinta County with nearby schools including Evanston High School and Evanston Child Development Center.
Ownership History
Date
Name
Owned For
Owner Type
Purchase Details
Closed on
Mar 16, 2012
Sold by
Thornton James B and Thornton Kathryn S
Bought by
Moore Cody S
Current Estimated Value
Home Financials for this Owner
Home Financials are based on the most recent Mortgage that was taken out on this home.
Original Mortgage
$273,760
Outstanding Balance
$186,974
Interest Rate
3.75%
Mortgage Type
FHA
Estimated Equity
$317,640
Purchase Details
Closed on
May 31, 2007
Sold by
Chuck Straw Construction Inc
Bought by
Thorton James B and Thorton Kathryn S
Home Financials for this Owner
Home Financials are based on the most recent Mortgage that was taken out on this home.
Original Mortgage
$251,516
Interest Rate
6.15%
Mortgage Type
New Conventional
Purchase Details
Closed on
Jul 7, 2006
Sold by
Huffman Richard T and Huffman Ellen B
Bought by
Chuck Straw Construction Inc
Create a Home Valuation Report for This Property
The Home Valuation Report is an in-depth analysis detailing your home's value as well as a comparison with similar homes in the area
Home Values in the Area
Average Home Value in this Area
Purchase History
| Date | Buyer | Sale Price | Title Company |
|---|---|---|---|
| Moore Cody S | -- | None Available | |
| Thorton James B | -- | None Available | |
| Chuck Straw Construction Inc | -- | None Available |
Source: Public Records
Mortgage History
| Date | Status | Borrower | Loan Amount |
|---|---|---|---|
| Open | Moore Cody S | $273,760 | |
| Previous Owner | Thorton James B | $251,516 |
Source: Public Records
Tax History Compared to Growth
Tax History
| Year | Tax Paid | Tax Assessment Tax Assessment Total Assessment is a certain percentage of the fair market value that is determined by local assessors to be the total taxable value of land and additions on the property. | Land | Improvement |
|---|---|---|---|---|
| 2025 | $2,809 | $32,148 | $2,227 | $29,921 |
| 2024 | $2,809 | $41,330 | $2,969 | $38,361 |
| 2023 | $3,021 | $44,657 | $2,824 | $41,833 |
| 2022 | $2,695 | $39,587 | $1,651 | $37,936 |
| 2021 | $2,296 | $33,680 | $1,651 | $32,029 |
| 2020 | $1,991 | $29,220 | $1,504 | $27,716 |
| 2019 | $1,901 | $27,948 | $1,406 | $26,542 |
| 2018 | $3,526 | $25,919 | $1,549 | $24,370 |
| 2017 | $1,755 | $25,827 | $1,549 | $24,278 |
| 2016 | $1,902 | $27,971 | $1,359 | $26,612 |
| 2015 | -- | $25,206 | $1,186 | $24,020 |
| 2014 | -- | $31,233 | $0 | $0 |
Source: Public Records
Map
Nearby Homes
- 132 Skyline Dr
- 132 Kings Ct
- 260 Darby Ln
- 104 Canyon Hollow Dr
- 240 Darby Ln
- 106 Grandview
- 104 Windy Ridge Ct
- 113 Butterfield Rd
- 155 Highridge Point
- 66 Aspen Grove Dr W
- 149 Toponce Dr
- 132 Silver Sage Dr
- 130 Silver Sage Dr
- 46 City View Dr
- 200 S Valley Lot 12 Dr
- 200 S Valley Lot 7 Dr
- 413 Crane Ave
- 427 Thayer Cir
- 223 Barber Ave
- 221 Barber Ave
- 118 Chandler Ln
- 121 Citation Ln
- 117 Citation Ln
- 123 Citation Ln
- 123 Citation Ln Unit Brookhollow
- 117 Chandler Ln
- 125 Citation Ln
- 115 Citation Ln
- 114 Chandler Ln
- 115 Chandler Ln
- 127 Citation Ln
- 118 Citation Ln
- 113 Chandler Ln
- 118 Carriage Dr
- 110 Chandler Ln
- 128 Brookhollow Dr
- 116 Carriage Dr
- 122 Citation Ln
- 131 Citation Ln
- 109 Chandler Ln