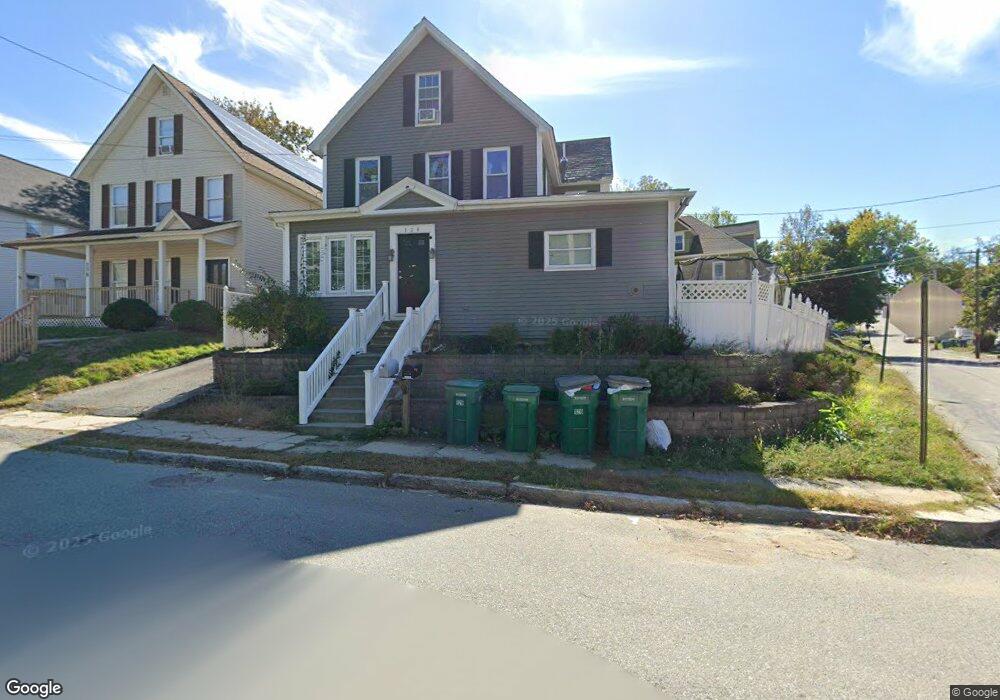
120 Charles St Fitchburg, MA 01420
Southside NeighborhoodEstimated Value: $436,000 - $556,000
3
Beds
2
Baths
2,985
Sq Ft
$164/Sq Ft
Est. Value
About This Home
This home is located at 120 Charles St, Fitchburg, MA 01420 and is currently estimated at $489,939, approximately $164 per square foot. 120 Charles St is a home located in Worcester County with nearby schools including South Street Elementary School, Reingold Elementary School, and Crocker Elementary School.
Ownership History
Date
Name
Owned For
Owner Type
Purchase Details
Closed on
Dec 10, 2014
Sold by
Vargas Carlos J
Bought by
120 Charles Street Rt and Veneziano
Current Estimated Value
Purchase Details
Closed on
Aug 26, 2003
Sold by
Orni Nancy L and Orni Peter J
Bought by
Flores Alicia
Home Financials for this Owner
Home Financials are based on the most recent Mortgage that was taken out on this home.
Original Mortgage
$165,600
Interest Rate
5.52%
Mortgage Type
Purchase Money Mortgage
Create a Home Valuation Report for This Property
The Home Valuation Report is an in-depth analysis detailing your home's value as well as a comparison with similar homes in the area
Home Values in the Area
Average Home Value in this Area
Purchase History
| Date | Buyer | Sale Price | Title Company |
|---|---|---|---|
| 120 Charles Street Rt | -- | -- | |
| Flores Alicia | $207,000 | -- |
Source: Public Records
Mortgage History
| Date | Status | Borrower | Loan Amount |
|---|---|---|---|
| Previous Owner | Flores Alicia | $165,600 |
Source: Public Records
Tax History Compared to Growth
Tax History
| Year | Tax Paid | Tax Assessment Tax Assessment Total Assessment is a certain percentage of the fair market value that is determined by local assessors to be the total taxable value of land and additions on the property. | Land | Improvement |
|---|---|---|---|---|
| 2025 | $51 | $374,500 | $83,900 | $290,600 |
| 2024 | $5,127 | $346,200 | $56,100 | $290,100 |
| 2023 | $5,090 | $317,700 | $46,300 | $271,400 |
| 2022 | $4,778 | $271,300 | $35,400 | $235,900 |
| 2021 | $4,286 | $225,200 | $26,800 | $198,400 |
| 2020 | $4,102 | $208,100 | $21,900 | $186,200 |
| 2019 | $3,733 | $182,200 | $30,500 | $151,700 |
| 2018 | $3,370 | $160,400 | $28,000 | $132,400 |
| 2017 | $3,116 | $145,000 | $25,600 | $119,400 |
| 2016 | $2,934 | $138,200 | $25,600 | $112,600 |
| 2015 | $2,930 | $141,700 | $26,800 | $114,900 |
| 2014 | $2,852 | $143,800 | $26,800 | $117,000 |
Source: Public Records
Map
Nearby Homes