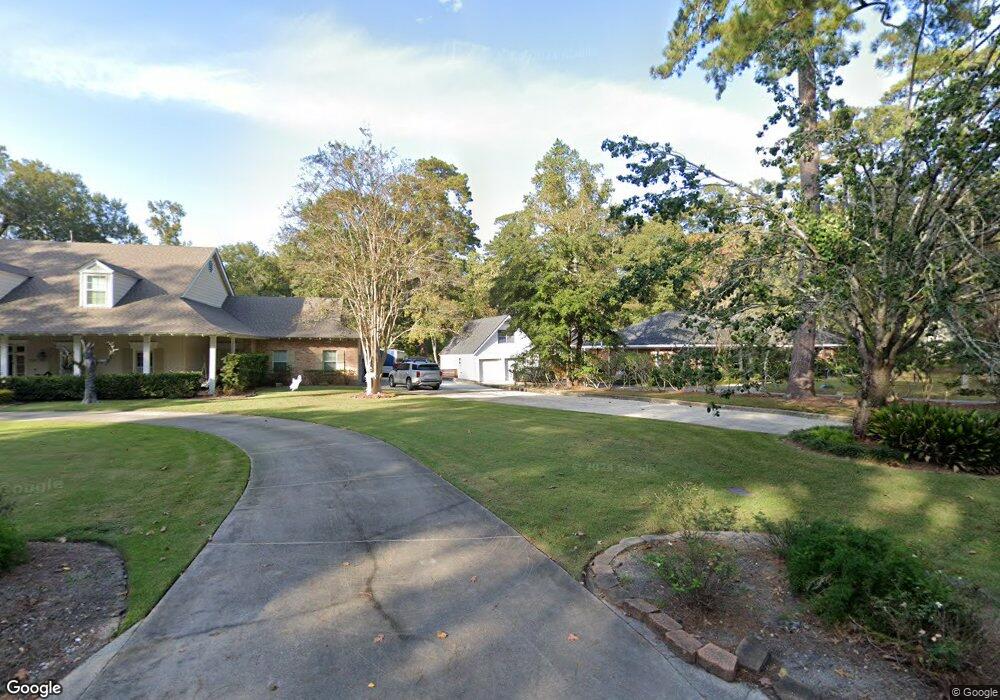
120 Cherrylaurel Dr Covington, LA 70433
Estimated Value: $457,971 - $604,000
Studio
--
Bath
3,045
Sq Ft
$170/Sq Ft
Est. Value
About This Home
This home is located at 120 Cherrylaurel Dr, Covington, LA 70433 and is currently estimated at $517,993, approximately $170 per square foot. 120 Cherrylaurel Dr is a home located in St. Tammany Parish with nearby schools including Pontchartrain Elementary School, Tchefuncte Middle School, and Mandeville Junior High School.
Ownership History
Date
Name
Owned For
Owner Type
Purchase Details
Closed on
Mar 10, 2025
Sold by
Hunter Allison
Bought by
Bezou Jacques F
Current Estimated Value
Purchase Details
Closed on
Dec 21, 2015
Sold by
Hall Sallie Knox Funderburg and Hall Benjamin James
Bought by
Barnes Tracy Wood and Barnes Harold K
Home Financials for this Owner
Home Financials are based on the most recent Mortgage that was taken out on this home.
Original Mortgage
$337,250
Interest Rate
3.98%
Mortgage Type
New Conventional
Create a Home Valuation Report for This Property
The Home Valuation Report is an in-depth analysis detailing your home's value as well as a comparison with similar homes in the area
Home Values in the Area
Average Home Value in this Area
Purchase History
| Date | Buyer | Sale Price | Title Company |
|---|---|---|---|
| Bezou Jacques F | $50,000 | None Listed On Document | |
| Barnes Tracy Wood | $355,000 | First American Title |
Source: Public Records
Mortgage History
| Date | Status | Borrower | Loan Amount |
|---|---|---|---|
| Previous Owner | Barnes Tracy Wood | $337,250 |
Source: Public Records
Tax History
| Year | Tax Paid | Tax Assessment Tax Assessment Total Assessment is a certain percentage of the fair market value that is determined by local assessors to be the total taxable value of land and additions on the property. | Land | Improvement |
|---|---|---|---|---|
| 2025 | $3,414 | $35,957 | $4,500 | $31,457 |
| 2024 | $3,414 | $35,957 | $4,500 | $31,457 |
| 2023 | $3,539 | $33,672 | $4,500 | $29,172 |
| 2022 | $346,909 | $33,672 | $4,500 | $29,172 |
| 2021 | $3,463 | $33,672 | $4,500 | $29,172 |
| 2020 | $3,459 | $33,672 | $4,500 | $29,172 |
| 2019 | $4,323 | $31,535 | $4,500 | $27,035 |
| 2018 | $4,329 | $31,535 | $4,500 | $27,035 |
| 2017 | $4,370 | $31,535 | $4,500 | $27,035 |
| 2016 | $4,404 | $31,535 | $4,500 | $27,035 |
| 2015 | $2,035 | $21,682 | $4,500 | $17,182 |
| 2014 | $2,014 | $21,682 | $4,500 | $17,182 |
| 2013 | -- | $21,682 | $4,500 | $17,182 |
Source: Public Records
Map
Nearby Homes
- 156 Belle Terre Blvd
- 113 Laurelwood Dr
- 194 Belle Terre Blvd
- 125 Bent Tree Ct
- 401 Country Club Dr
- 139 Crepemyrtle Rd
- 0 Woodberry Dr Unit 2540496
- 1516 Aristocrat Ct
- 423 River Oaks Dr
- 514 River Oaks Dr
- LOT 6 Rhonda Ct
- 124 Country Club Dr
- 0 Pine Cone - Lot #18 Ct Unit 2433464
- 0 Pine Cone Lot#19 Ct Unit 2433525
- 196 Tchefuncte Dr
- 198 Tchefuncte Dr
- 217 Tchefuncte Dr
- 120 Cherry Laurel Dr
- 122 Cherrylaurel Dr
- 122 Cherry Laurel Dr
- 116 Cherrylaurel Dr
- 114 Cherrylaurel Dr
- 114 Cherry Laurel Dr
- 119 Cherrylaurel Dr
- 117 Cherrylaurel Dr
- 117 Cherry Laurel Dr
- 124 Cherrylaurel Dr
- 124 Cherry Laurel Dr
- 173 Belle Terre Blvd
- 171 Belle Terre Blvd
- 115 Cherrylaurel Dr
- 175 Belle Terre Blvd
- 167 Belle Terre Blvd
- 169 Belle Terre Blvd
- 121 Cherry Laurel Dr
- 121 Cherrylaurel Dr
- 177 Belle Terre Blvd
Your Personal Tour Guide
Ask me questions while you tour the home.