120 Chris de Loop Ln Moncks Corner, SC 29461
Estimated Value: $342,000 - $445,000
Studio
--
Bath
1,404
Sq Ft
$273/Sq Ft
Est. Value
About This Home
This home is located at 120 Chris de Loop Ln, Moncks Corner, SC 29461 and is currently estimated at $383,000, approximately $272 per square foot. 120 Chris de Loop Ln is a home located in Berkeley County with nearby schools including Whitesville Elementary School, Berkeley Middle School, and Berkeley High School.
Ownership History
Date
Name
Owned For
Owner Type
Purchase Details
Closed on
Mar 23, 2021
Sold by
Guerry Elwood Levin and Guerry Sandra D
Bought by
Parson Brandon L
Current Estimated Value
Purchase Details
Closed on
Sep 26, 2005
Sold by
Guerry Ezra Dean
Bought by
Guerry Elwood Levin and Guerry Sandra D
Purchase Details
Closed on
Jun 11, 2004
Sold by
Guerry Elwood Levin
Bought by
Guerry Elwood Levin and Guerry Sandra D
Purchase Details
Closed on
Jul 30, 2003
Sold by
Guerry Ezra Dean and Guerry Elwood Levin
Bought by
Guerry Elwood Levin
Purchase Details
Closed on
Jun 4, 2003
Sold by
Guerry Ezra Dean and Guerry Elwood Levin
Bought by
Guerry Ezra Dean
Purchase Details
Closed on
May 20, 2003
Sold by
Guerry Ezra Dean
Bought by
Guerry Ezra Dean
Create a Home Valuation Report for This Property
The Home Valuation Report is an in-depth analysis detailing your home's value as well as a comparison with similar homes in the area
Purchase History
| Date | Buyer | Sale Price | Title Company |
|---|---|---|---|
| Parson Brandon L | -- | None Available | |
| Guerry Elwood Levin | -- | None Available | |
| Guerry Elwood Levin | -- | -- | |
| Guerry Elwood Levin | -- | -- | |
| Guerry Ezra Dean | -- | -- | |
| Guerry Elwood Levin | -- | -- | |
| Guerry Ezra Dean | -- | -- | |
| Guerry Elwood Levin | -- | -- |
Source: Public Records
Tax History
| Year | Tax Paid | Tax Assessment Tax Assessment Total Assessment is a certain percentage of the fair market value that is determined by local assessors to be the total taxable value of land and additions on the property. | Land | Improvement |
|---|---|---|---|---|
| 2025 | $721 | $187,266 | $79,587 | $107,679 |
| 2024 | $683 | $7,490 | $3,183 | $4,307 |
| 2023 | $683 | $7,490 | $3,183 | $4,307 |
| 2022 | $2,733 | $6,514 | $1,839 | $4,675 |
| 2021 | $672 | $6,510 | $1,839 | $4,675 |
| 2020 | $680 | $6,514 | $1,839 | $4,675 |
| 2019 | $676 | $6,514 | $1,839 | $4,675 |
| 2018 | $609 | $5,664 | $1,700 | $3,964 |
| 2017 | $570 | $5,664 | $1,700 | $3,964 |
| 2016 | $581 | $5,660 | $1,700 | $3,960 |
| 2015 | $543 | $5,660 | $1,700 | $3,960 |
| 2014 | $534 | $5,660 | $1,700 | $3,960 |
| 2013 | -- | $5,660 | $1,700 | $3,960 |
Source: Public Records
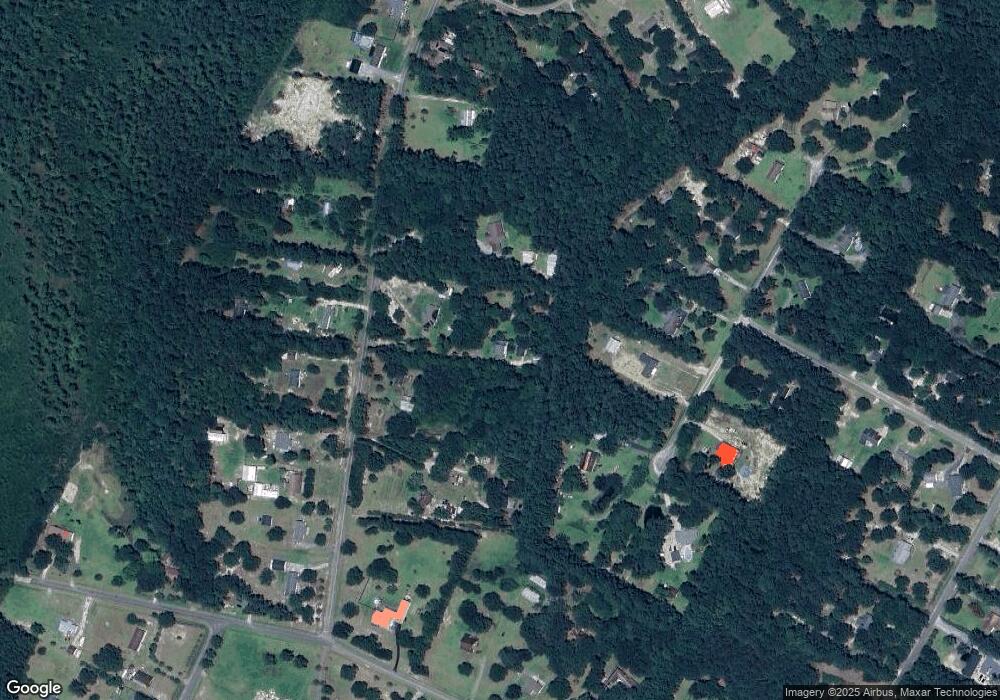
Map
Nearby Homes
- 227 Old Grove Ave
- 220 Old Grove Ave
- 207 New Grade Rd
- 000 Tullis St
- 123 Kyseth Ln
- 108 Nyler Ct
- 560 Farrell St
- 139 Sea Lavender Ln
- 161 Sea Lavender Ln
- 181 Sea Lavender Ln
- 184 Sea Lavender Ln
- 249 Waterfront Park Dr
- 245 Waterfront Park Dr
- 120 Tugboat Ln
- 318 Oyster Bay Dr
- 325 Winding Rd
- 132 Wild Holly Dr
- 628 Deepwood Ct
- 2429 S Live Oak Dr
- 417 Tallow Ct
- 246 Old Grade Rd
- 238 Old Grade Rd
- 256 Old Grade Rd
- 113 Winter Ct
- 224 Old Grade Rd
- 111 Winter Ct
- 226 Old Grade Rd
- 109 Winter Ct
- 220 Old Grade Rd
- 137 Winter Ct
- 222 Old Grade Rd
- 225 Old Grade Rd
- 223 Old Grade Rd
- 205 Winter Ct
- 259 Old Grade Rd
- 104 Penny Ln
- 209 Winter Ct
- 216 Old Grade Rd
- 219 Old Grade Rd
- 274 Old Grade Rd
Your Personal Tour Guide
Ask me questions while you tour the home.