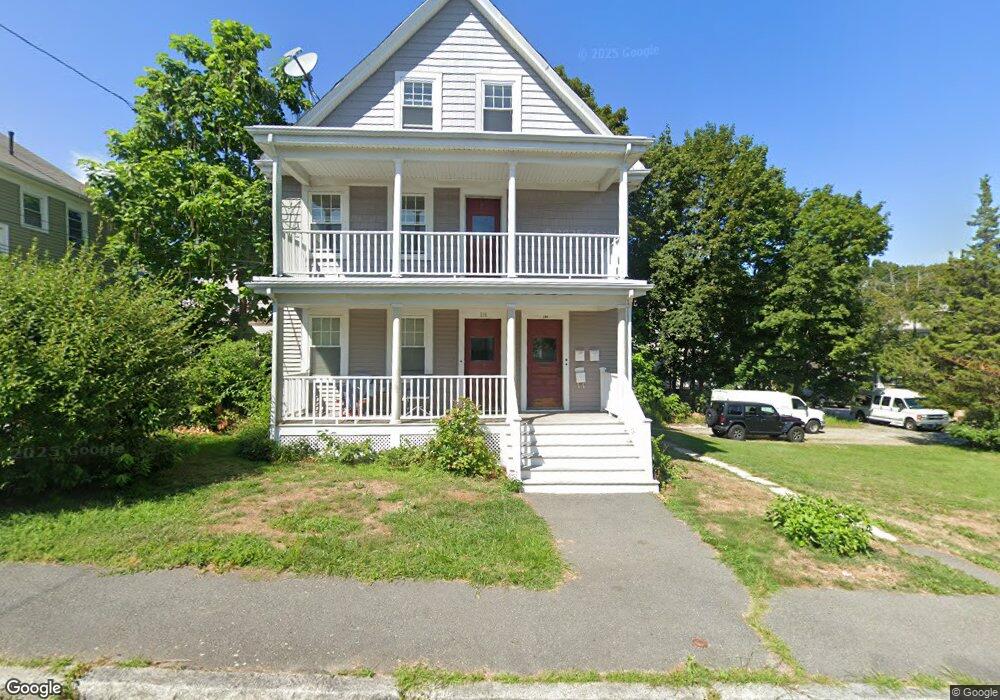
120 Cranch St Quincy, MA 02169
Quincy Center NeighborhoodEstimated Value: $835,841 - $1,080,000
5
Beds
3
Baths
2,430
Sq Ft
$390/Sq Ft
Est. Value
About This Home
This home is located at 120 Cranch St, Quincy, MA 02169 and is currently estimated at $947,710, approximately $390 per square foot. 120 Cranch St is a home located in Norfolk County with nearby schools including Charles A. Bernazzani Elementary School, Central Middle School, and Quincy High School.
Ownership History
Date
Name
Owned For
Owner Type
Purchase Details
Closed on
Mar 23, 2001
Sold by
Gershman Carol
Bought by
Finn John P
Current Estimated Value
Home Financials for this Owner
Home Financials are based on the most recent Mortgage that was taken out on this home.
Original Mortgage
$289,275
Outstanding Balance
$104,624
Interest Rate
6.93%
Mortgage Type
Purchase Money Mortgage
Estimated Equity
$843,086
Create a Home Valuation Report for This Property
The Home Valuation Report is an in-depth analysis detailing your home's value as well as a comparison with similar homes in the area
Home Values in the Area
Average Home Value in this Area
Purchase History
| Date | Buyer | Sale Price | Title Company |
|---|---|---|---|
| Finn John P | $295,000 | -- |
Source: Public Records
Mortgage History
| Date | Status | Borrower | Loan Amount |
|---|---|---|---|
| Open | Finn John P | $289,275 |
Source: Public Records
Tax History Compared to Growth
Tax History
| Year | Tax Paid | Tax Assessment Tax Assessment Total Assessment is a certain percentage of the fair market value that is determined by local assessors to be the total taxable value of land and additions on the property. | Land | Improvement |
|---|---|---|---|---|
| 2025 | $9,467 | $821,100 | $309,300 | $511,800 |
| 2024 | $8,983 | $797,100 | $294,700 | $502,400 |
| 2023 | $8,177 | $734,700 | $268,100 | $466,600 |
| 2022 | $8,128 | $678,500 | $243,900 | $434,600 |
| 2021 | $8,112 | $668,200 | $243,900 | $424,300 |
| 2020 | $8,009 | $644,300 | $232,300 | $412,000 |
| 2019 | $7,910 | $630,300 | $219,300 | $411,000 |
| 2018 | $7,066 | $529,700 | $219,300 | $310,400 |
| 2017 | $7,173 | $506,200 | $209,000 | $297,200 |
| 2016 | $6,685 | $465,500 | $199,100 | $266,400 |
| 2015 | $6,685 | $457,900 | $199,100 | $258,800 |
| 2014 | $6,127 | $412,300 | $189,700 | $222,600 |
Source: Public Records
Map
Nearby Homes
- 293 Whitwell St
- 73 Scotch Pond Place
- 195 Thomas Burgin Pkwy Unit 205
- 73 Cranch St Unit 73
- 215 Thomas Burgin Pkwy Unit 35
- 165 Granite St
- 118 Dimmock St
- 18 Cliveden St Unit 201W
- 2 Cliveden St Unit 601E
- 33 Brook Rd
- 20 Whitney Rd
- 20 Whitney Rd Unit 307
- 20 Whitney Rd Unit 101
- 64 Garfield St Unit B
- 1 Adams St Unit 502
- 8 Jackson St Unit B2
- 94 Brook Rd Unit 3
- 77 Adams St Unit 610
- 36 Bigelow St
- 5 Pearl St
- 112 Cranch St
- 999 Confidential
- 999 Confidential
- 117 Cranch St
- 108 Cranch St
- 113 Cranch St
- 113 Cranch St Unit 113
- 119 Cranch St
- 253 Whitwell St
- 253 Whitwell St Unit 2
- 255 Whitwell St
- 253 Whitwell St Unit 2L
- 265A Whitwell St
- 261 Whitwell St Unit 265
- 263 Whitwell St Unit 3
- 263 Whitwell St
- 107 Cranch St
- 249 Whitwell St
- 18 Deldorf St
- 18 Deldorf St Unit 1