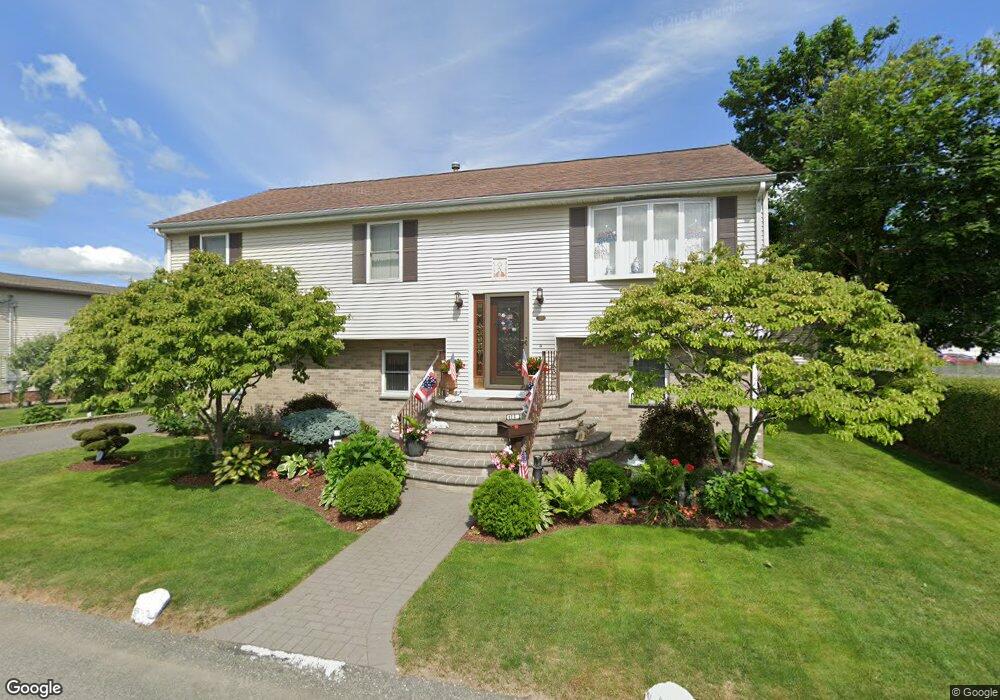
120 Crane St Fall River, MA 02723
Flint NeighborhoodEstimated Value: $377,000 - $448,000
3
Beds
2
Baths
1,196
Sq Ft
$339/Sq Ft
Est. Value
About This Home
This home is located at 120 Crane St, Fall River, MA 02723 and is currently estimated at $405,958, approximately $339 per square foot. 120 Crane St is a home located in Bristol County with nearby schools including Mary Fonseca Elementary School, Talbot Innovation School, and B M C Durfee High School.
Ownership History
Date
Name
Owned For
Owner Type
Purchase Details
Closed on
Apr 15, 2022
Sold by
Martins Jose O and Martins Maria D
Bought by
Martins Jose O and Martins Maria D
Current Estimated Value
Purchase Details
Closed on
Aug 7, 1996
Sold by
Cabral Timothy
Bought by
Martins Jose O and Martins Maria D
Home Financials for this Owner
Home Financials are based on the most recent Mortgage that was taken out on this home.
Original Mortgage
$107,000
Interest Rate
8.24%
Mortgage Type
Purchase Money Mortgage
Create a Home Valuation Report for This Property
The Home Valuation Report is an in-depth analysis detailing your home's value as well as a comparison with similar homes in the area
Home Values in the Area
Average Home Value in this Area
Purchase History
| Date | Buyer | Sale Price | Title Company |
|---|---|---|---|
| Martins Jose O | -- | None Available | |
| Martins Jose O | $116,000 | -- |
Source: Public Records
Mortgage History
| Date | Status | Borrower | Loan Amount |
|---|---|---|---|
| Previous Owner | Martins Jose O | $100,000 | |
| Previous Owner | Martins Jose O | $107,000 |
Source: Public Records
Tax History Compared to Growth
Tax History
| Year | Tax Paid | Tax Assessment Tax Assessment Total Assessment is a certain percentage of the fair market value that is determined by local assessors to be the total taxable value of land and additions on the property. | Land | Improvement |
|---|---|---|---|---|
| 2025 | $3,846 | $335,900 | $108,300 | $227,600 |
| 2024 | $3,509 | $305,400 | $104,300 | $201,100 |
| 2023 | $3,144 | $256,200 | $86,200 | $170,000 |
| 2022 | $2,861 | $226,700 | $82,100 | $144,600 |
| 2021 | $2,943 | $212,800 | $78,100 | $134,700 |
| 2020 | $2,942 | $203,600 | $76,900 | $126,700 |
| 2019 | $2,928 | $200,800 | $74,100 | $126,700 |
| 2018 | $2,838 | $194,100 | $80,300 | $113,800 |
| 2017 | $2,605 | $186,100 | $76,500 | $109,600 |
| 2016 | $2,423 | $177,800 | $81,400 | $96,400 |
| 2015 | $2,319 | $177,300 | $81,400 | $95,900 |
| 2014 | $2,200 | $174,900 | $79,000 | $95,900 |
Source: Public Records
Map
Nearby Homes
- 159 Covel St
- 138 18th St
- 48 Rocliffe St
- 32 Quequechan St
- 34 Quequechan St
- 14 Downing St
- 108 16th St
- 33 Plain St
- 88 Harrison St Unit 5
- 344 Beattie St Unit 5
- 120 15th St Unit 5
- 83 Jencks St
- 23 Lexington St
- 1244 Pleasant St
- 209 Harrison St
- 992 Pine St
- 243 Oak Grove Ave
- 218 Plain St
- 235 Chavenson St
- 178 Thomas St