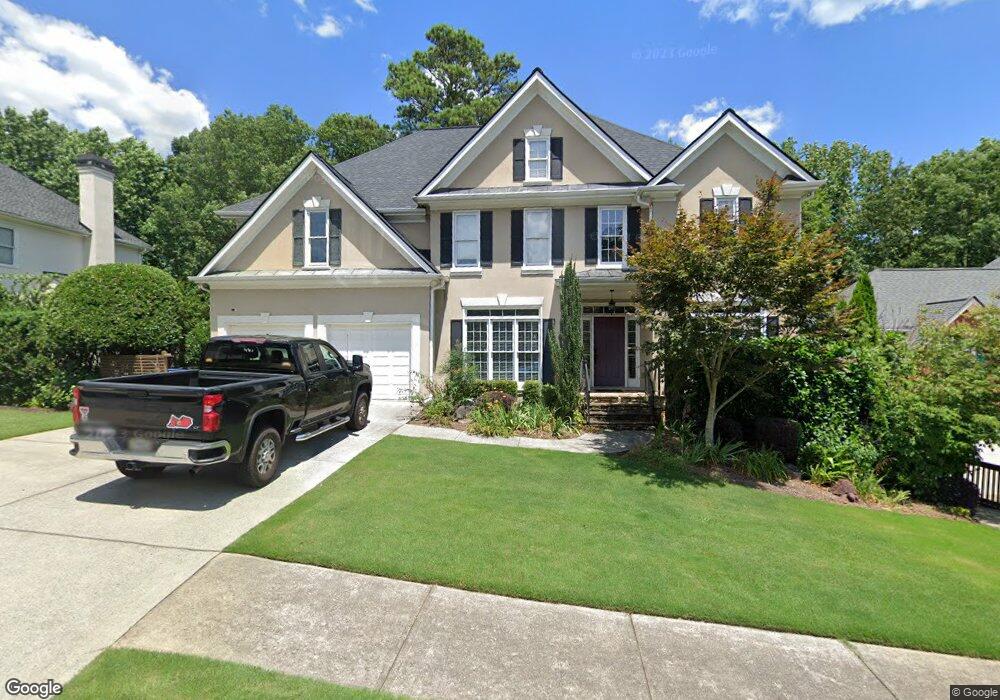
120 Cupit Close Alpharetta, GA 30022
Newtown NeighborhoodEstimated Value: $730,901 - $812,000
4
Beds
4
Baths
2,773
Sq Ft
$279/Sq Ft
Est. Value
About This Home
This home is located at 120 Cupit Close, Alpharetta, GA 30022 and is currently estimated at $773,975, approximately $279 per square foot. 120 Cupit Close is a home located in Fulton County with nearby schools including Barnwell Elementary School, Haynes Bridge Middle School, and Centennial High School.
Ownership History
Date
Name
Owned For
Owner Type
Purchase Details
Closed on
Apr 12, 2023
Sold by
Mcelfresh John R Estate
Bought by
Mcelfresh Katherine S
Current Estimated Value
Purchase Details
Closed on
Mar 11, 2011
Sold by
Blueprint Capital Llc
Bought by
Wooden James E and Mcelfresh Katherine
Home Financials for this Owner
Home Financials are based on the most recent Mortgage that was taken out on this home.
Original Mortgage
$244,000
Interest Rate
4.77%
Mortgage Type
New Conventional
Purchase Details
Closed on
Aug 12, 2008
Sold by
Silver Tree Capital Corp
Bought by
Blueprint Capital Llc
Purchase Details
Closed on
Dec 4, 2007
Sold by
Hsu Allen
Bought by
Silver Tree Capital Corp
Purchase Details
Closed on
Nov 13, 2002
Sold by
Kim Junglin
Bought by
Hsu Allen
Home Financials for this Owner
Home Financials are based on the most recent Mortgage that was taken out on this home.
Original Mortgage
$174,000
Interest Rate
6.3%
Mortgage Type
New Conventional
Purchase Details
Closed on
Apr 14, 1997
Sold by
D E Chandler Properties Inc
Bought by
Kim Junglin
Create a Home Valuation Report for This Property
The Home Valuation Report is an in-depth analysis detailing your home's value as well as a comparison with similar homes in the area
Home Values in the Area
Average Home Value in this Area
Purchase History
| Date | Buyer | Sale Price | Title Company |
|---|---|---|---|
| Mcelfresh Katherine S | -- | -- | |
| Wooden James E | $305,000 | -- | |
| Blueprint Capital Llc | $255,000 | -- | |
| Silver Tree Capital Corp | $250,500 | -- | |
| Hsu Allen | $290,000 | -- | |
| Kim Junglin | $267,000 | -- |
Source: Public Records
Mortgage History
| Date | Status | Borrower | Loan Amount |
|---|---|---|---|
| Previous Owner | Wooden James E | $244,000 | |
| Previous Owner | Hsu Allen | $174,000 |
Source: Public Records
Tax History Compared to Growth
Tax History
| Year | Tax Paid | Tax Assessment Tax Assessment Total Assessment is a certain percentage of the fair market value that is determined by local assessors to be the total taxable value of land and additions on the property. | Land | Improvement |
|---|---|---|---|---|
| 2025 | $7,346 | $235,520 | $59,880 | $175,640 |
| 2023 | $6,438 | $228,080 | $72,160 | $155,920 |
| 2022 | $5,953 | $194,000 | $48,320 | $145,680 |
| 2021 | $5,100 | $161,880 | $39,400 | $122,480 |
| 2020 | $5,976 | $185,640 | $40,480 | $145,160 |
| 2019 | $670 | $169,880 | $36,000 | $133,880 |
| 2018 | $4,810 | $147,680 | $31,360 | $116,320 |
| 2017 | $4,915 | $144,400 | $27,760 | $116,640 |
| 2016 | $4,844 | $144,400 | $27,760 | $116,640 |
| 2015 | $4,897 | $144,400 | $27,760 | $116,640 |
| 2014 | $4,067 | $115,320 | $37,240 | $78,080 |
Source: Public Records
Map
Nearby Homes
- 3450 Merganser Ln
- 9510 Stoney Ridge Ln
- 3535 Merganser Ln Unit 2
- 9675 Almaviva Dr
- 9695 Almaviva Dr
- 9715 Almaviva Dr
- 835 Kings Arms Way
- 150 Stoney Ridge Dr
- 710 Leeds Garden Terrace
- 140 Old Sandhurst Landing
- 375 N Peak Dr
- 615 S Preston Ct
- 545 Oak Bridge Trail
- 9320 Brumbelow Crossing Way
- 595 Oak Alley Way
- 352 N Peak Dr
- 515 Oak Bridge Trail
- 180 Preston Oaks Dr
- 440 Guildhall Grove Unit 2
- 110 Cupit Close Unit I
- 130 Cupit Close
- 225 Kirkton Knolls
- 215 Kirkton Knolls Unit basement apt
- 215 Kirkton Knolls Unit 1
- 115 Cupit Close Unit 1
- 3375 Marquess Moor
- 140 Cupit Close
- 235 Kirkton Knolls Unit 1
- 105 Cupit Close
- 3385 Marquess Moor
- 125 Cupit Close Unit 1
- 3395 Marquess Moor
- 3350 Merganser Ln
- 3350 Merganser Ln Unit N/A
- 3360 Merganser Ln
- 3340 Merganser Ln
- 245 Kirkton Knolls
- 3370 Merganser Ln
- 210 Kirkton Knolls Unit I