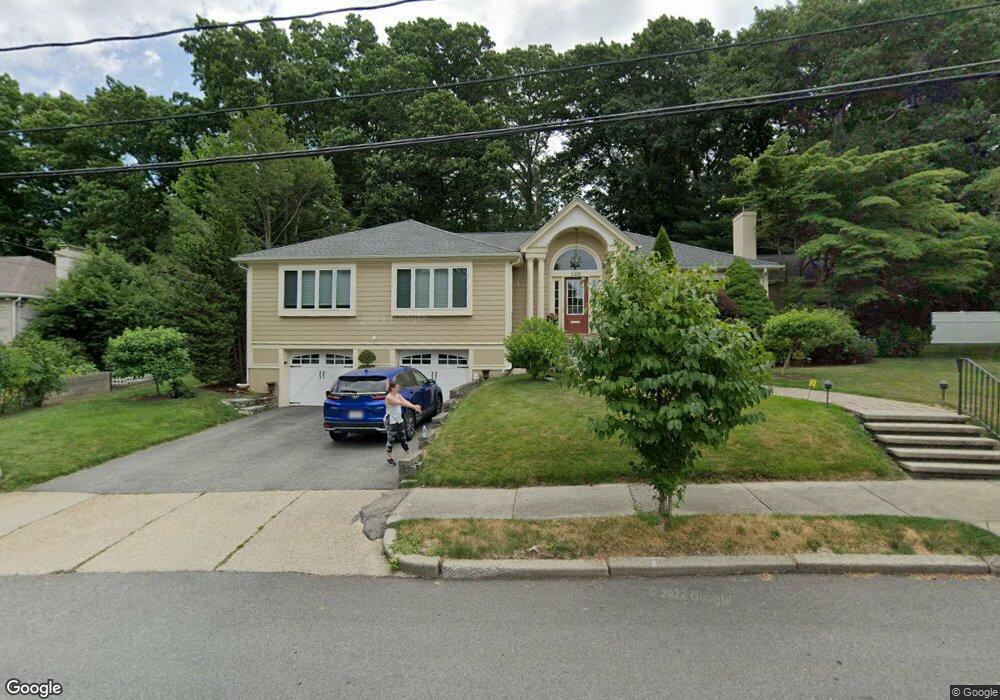
120 Cynthia Rd Newton Center, MA 02459
Oak Hill NeighborhoodEstimated Value: $2,063,043 - $2,380,000
4
Beds
4
Baths
2,766
Sq Ft
$782/Sq Ft
Est. Value
About This Home
This home is located at 120 Cynthia Rd, Newton Center, MA 02459 and is currently estimated at $2,163,261, approximately $782 per square foot. 120 Cynthia Rd is a home located in Middlesex County with nearby schools including Memorial Spaulding Elementary School, Oak Hill Middle School, and Newton South High School.
Ownership History
Date
Name
Owned For
Owner Type
Purchase Details
Closed on
Sep 6, 2002
Sold by
Lank Harley J and Lank Audra S
Bought by
Geller Cary P and Tracy Fischer S
Current Estimated Value
Purchase Details
Closed on
Jul 1, 1998
Sold by
Clinton Steven K and Kostyk Sandra K
Bought by
Lank Harley J and Lank Audra S
Purchase Details
Closed on
Jul 15, 1992
Sold by
Germaise Irwin L and Germaise Deanna
Bought by
Clinton Steven K and Kostyk Sandra K
Create a Home Valuation Report for This Property
The Home Valuation Report is an in-depth analysis detailing your home's value as well as a comparison with similar homes in the area
Home Values in the Area
Average Home Value in this Area
Purchase History
| Date | Buyer | Sale Price | Title Company |
|---|---|---|---|
| Geller Cary P | $860,000 | -- | |
| Lank Harley J | $550,000 | -- | |
| Clinton Steven K | $380,000 | -- |
Source: Public Records
Mortgage History
| Date | Status | Borrower | Loan Amount |
|---|---|---|---|
| Open | Clinton Steven K | $241,000 | |
| Closed | Clinton Steven K | $245,000 | |
| Closed | Clinton Steven K | $249,000 |
Source: Public Records
Tax History Compared to Growth
Tax History
| Year | Tax Paid | Tax Assessment Tax Assessment Total Assessment is a certain percentage of the fair market value that is determined by local assessors to be the total taxable value of land and additions on the property. | Land | Improvement |
|---|---|---|---|---|
| 2025 | $15,949 | $1,627,400 | $1,203,800 | $423,600 |
| 2024 | $15,421 | $1,580,000 | $1,168,700 | $411,300 |
| 2023 | $14,755 | $1,449,400 | $907,800 | $541,600 |
| 2022 | $14,118 | $1,342,000 | $840,600 | $501,400 |
| 2021 | $13,622 | $1,266,000 | $793,000 | $473,000 |
| 2020 | $13,217 | $1,266,000 | $793,000 | $473,000 |
| 2019 | $12,844 | $1,229,100 | $769,900 | $459,200 |
| 2018 | $12,672 | $1,171,200 | $704,500 | $466,700 |
| 2017 | $11,466 | $1,031,100 | $664,600 | $366,500 |
| 2016 | $10,966 | $963,600 | $621,100 | $342,500 |
| 2015 | $10,456 | $900,600 | $580,500 | $320,100 |
Source: Public Records
Map
Nearby Homes
- 63 Drumlin Rd
- 99 Baldpate Hill Rd
- 59 Deborah Rd
- 56 Cynthia Rd
- 41 Juniper Ln
- 135 Hartman Rd
- 44 Lovett Rd
- 21 Lovett Rd
- 65 Levbert Rd
- 36 Ober Rd
- 70 Pond Brook Rd
- 14 Rolling Ln
- 109 Harwich Rd
- 58 Country Club Rd
- 853 Dedham St
- 133 Oak Hill St
- 136 Dudley Rd
- 80 Louise Rd Unit 82
- 79 Florence St Unit 600S
- 79 Florence St Unit 402S