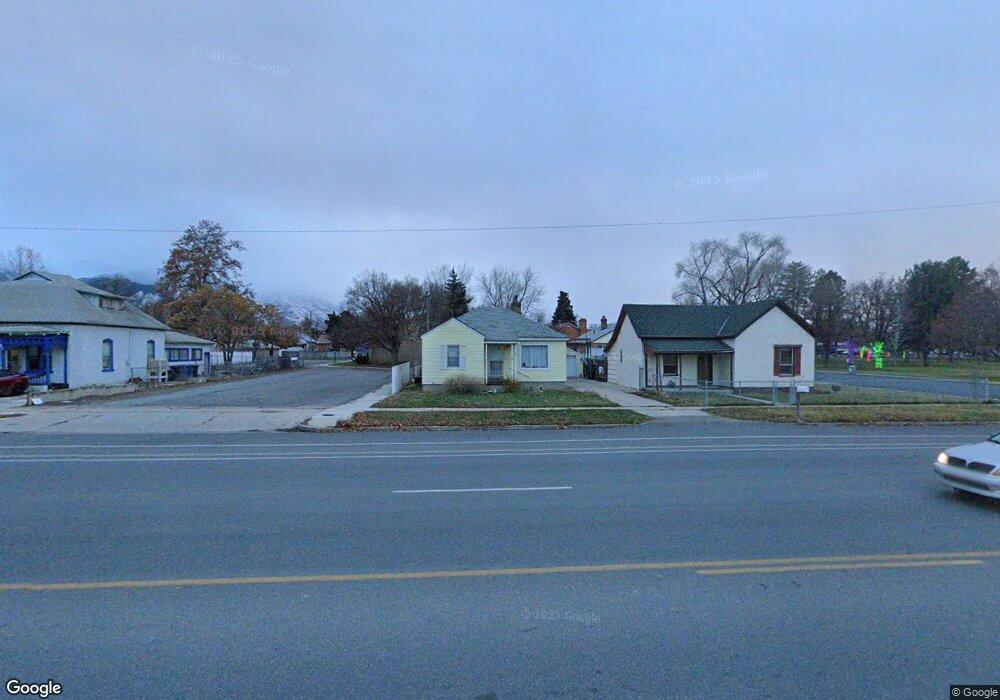
120 E Center St Spanish Fork, UT 84660
Estimated Value: $319,000 - $395,000
4
Beds
2
Baths
1,584
Sq Ft
$228/Sq Ft
Est. Value
About This Home
This home is located at 120 E Center St, Spanish Fork, UT 84660 and is currently estimated at $361,804, approximately $228 per square foot. 120 E Center St is a home located in Utah County with nearby schools including Park Elementary School, Spanish Fork Jr High School, and Spanish Fork High School.
Ownership History
Date
Name
Owned For
Owner Type
Purchase Details
Closed on
Mar 23, 2010
Sold by
Garcia Rick
Bought by
Garcia Rick and Garcia Benjamin Kimberly
Current Estimated Value
Home Financials for this Owner
Home Financials are based on the most recent Mortgage that was taken out on this home.
Original Mortgage
$135,500
Outstanding Balance
$91,010
Interest Rate
5.25%
Mortgage Type
FHA
Estimated Equity
$270,794
Purchase Details
Closed on
Mar 31, 2006
Sold by
Vest Chester S and Vest Kristine L
Bought by
Collett Clay Ian and Peterson Jennifer L
Home Financials for this Owner
Home Financials are based on the most recent Mortgage that was taken out on this home.
Original Mortgage
$123,068
Interest Rate
6.2%
Mortgage Type
FHA
Purchase Details
Closed on
Feb 26, 2003
Sold by
Boyack Louise
Bought by
Vest Chester S and Vest Kristine L
Create a Home Valuation Report for This Property
The Home Valuation Report is an in-depth analysis detailing your home's value as well as a comparison with similar homes in the area
Home Values in the Area
Average Home Value in this Area
Purchase History
| Date | Buyer | Sale Price | Title Company |
|---|---|---|---|
| Garcia Rick | -- | Provo Land Title Company | |
| Garcia Rick | -- | Provo Land Title Company | |
| Collett Clay Ian | -- | Utah Standard Title | |
| Vest Chester S | -- | Empire Land Title Company |
Source: Public Records
Mortgage History
| Date | Status | Borrower | Loan Amount |
|---|---|---|---|
| Open | Garcia Rick | $135,500 | |
| Previous Owner | Collett Clay Ian | $123,068 |
Source: Public Records
Tax History
| Year | Tax Paid | Tax Assessment Tax Assessment Total Assessment is a certain percentage of the fair market value that is determined by local assessors to be the total taxable value of land and additions on the property. | Land | Improvement |
|---|---|---|---|---|
| 2025 | $1,607 | $180,950 | -- | -- |
| 2024 | $1,607 | $165,605 | $0 | $0 |
| 2023 | $1,619 | $167,035 | $0 | $0 |
| 2022 | $1,636 | $165,605 | $0 | $0 |
| 2021 | $1,403 | $227,200 | $74,200 | $153,000 |
| 2020 | $1,268 | $199,600 | $61,800 | $137,800 |
| 2019 | $1,097 | $181,600 | $61,800 | $119,800 |
| 2018 | $1,037 | $166,000 | $61,800 | $104,200 |
| 2017 | $930 | $80,025 | $0 | $0 |
| 2016 | $832 | $70,620 | $0 | $0 |
| 2015 | $776 | $65,065 | $0 | $0 |
| 2014 | $785 | $66,110 | $0 | $0 |
Source: Public Records
Map
Nearby Homes
Your Personal Tour Guide
Ask me questions while you tour the home.