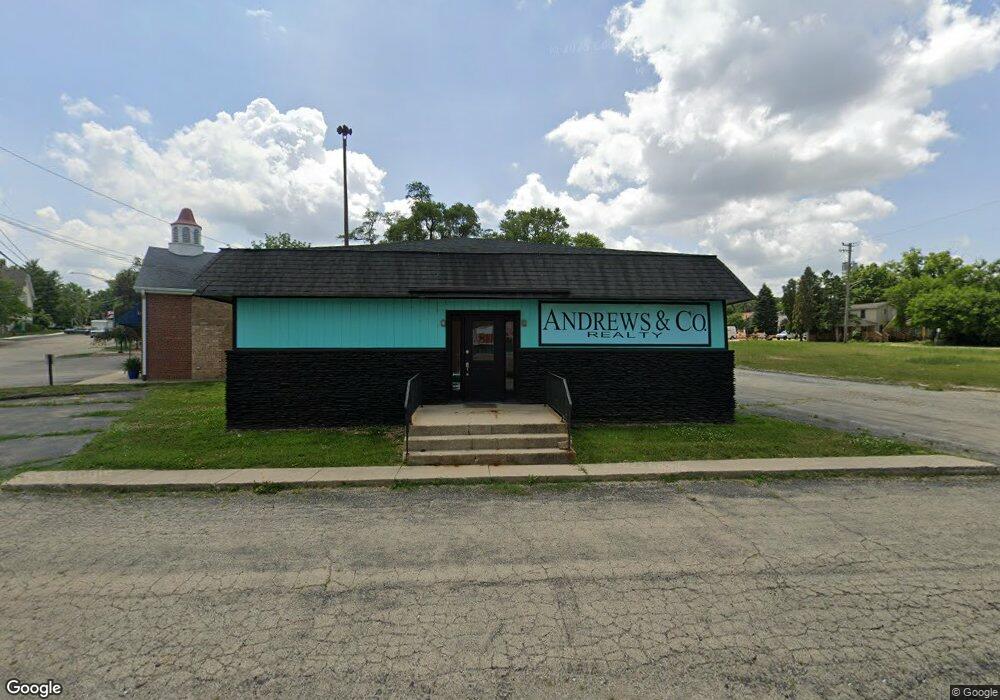
120 E Maple St New Lenox, IL 60451
Estimated Value: $221,624
--
Bed
--
Bath
--
Sq Ft
6,098
Sq Ft Lot
About This Home
This home is located at 120 E Maple St, New Lenox, IL 60451 and is currently estimated at $221,624. 120 E Maple St is a home located in Will County with nearby schools including Bentley Elementary School, Arnold J Tyler School, and Alex M Martino Jr High School.
Ownership History
Date
Name
Owned For
Owner Type
Purchase Details
Closed on
Aug 21, 2021
Sold by
Tkr Properties Inc
Bought by
Andrews Holdings Llc
Current Estimated Value
Home Financials for this Owner
Home Financials are based on the most recent Mortgage that was taken out on this home.
Original Mortgage
$152,781
Outstanding Balance
$138,716
Interest Rate
2.8%
Mortgage Type
Future Advance Clause Open End Mortgage
Estimated Equity
$82,908
Purchase Details
Closed on
Aug 20, 2019
Sold by
Tsamis Frances
Bought by
Tkr Properties
Purchase Details
Closed on
Aug 27, 2015
Sold by
Village Of New Lenox
Bought by
Tsamis Frances
Home Financials for this Owner
Home Financials are based on the most recent Mortgage that was taken out on this home.
Original Mortgage
$100,000
Interest Rate
3.84%
Mortgage Type
Commercial
Purchase Details
Closed on
Mar 4, 2015
Sold by
Whitaker Ronald M and Whitaker Mary F
Bought by
Village Of New Lenox
Create a Home Valuation Report for This Property
The Home Valuation Report is an in-depth analysis detailing your home's value as well as a comparison with similar homes in the area
Home Values in the Area
Average Home Value in this Area
Purchase History
| Date | Buyer | Sale Price | Title Company |
|---|---|---|---|
| Andrews Holdings Llc | $185,871 | None Available | |
| Tkr Properties | $185,000 | Attorney | |
| Tsamis Frances | $153,579 | Attorney | |
| Village Of New Lenox | -- | None Available |
Source: Public Records
Mortgage History
| Date | Status | Borrower | Loan Amount |
|---|---|---|---|
| Open | Andrews Holdings Llc | $152,781 | |
| Previous Owner | Tsamis Frances | $100,000 |
Source: Public Records
Tax History Compared to Growth
Tax History
| Year | Tax Paid | Tax Assessment Tax Assessment Total Assessment is a certain percentage of the fair market value that is determined by local assessors to be the total taxable value of land and additions on the property. | Land | Improvement |
|---|---|---|---|---|
| 2024 | $5,931 | $73,083 | $41,618 | $31,465 |
| 2023 | $5,931 | $73,083 | $41,618 | $31,465 |
| 2022 | $6,381 | $71,482 | $40,017 | $31,465 |
| 2021 | $6,265 | $71,482 | $40,017 | $31,465 |
| 2020 | $6,420 | $71,482 | $40,017 | $31,465 |
| 2019 | $6,260 | $71,482 | $40,017 | $31,465 |
| 2018 | $6,278 | $70,697 | $39,232 | $31,465 |
| 2017 | $6,153 | $70,697 | $39,232 | $31,465 |
| 2016 | $6,149 | $70,697 | $39,232 | $31,465 |
| 2015 | $6,242 | $70,697 | $39,232 | $31,465 |
| 2014 | $6,242 | $70,697 | $39,232 | $31,465 |
| 2013 | $6,242 | $70,697 | $39,232 | $31,465 |
Source: Public Records
Map
Nearby Homes
- 315 S Pine St
- 00 NE Corner Cherry Hill Road and Moss Lane Rd
- 416 Manor Ct Unit B
- 328 E Lincoln Hwy
- 105 Roy St
- 218 Manor Dr Unit A
- 524 Waverly Ct Unit D
- 574 Prairie Crossing Dr
- 718 S Prairie Rd
- 235 Roberts Rd
- 224 Hauser Ct
- 331 Old Hickory Rd
- 203 Tonell Ave
- 217 Aspen Dr
- 338 Willow St
- 808 Stonegate Rd
- Vacant W Maple St
- 1017 E Lincoln Hwy
- 807 Picardy Place
- 449 Somerset Ln Unit 1
- 201 Church St
- 204 N Cedar Rd Unit B
- 204 N Cedar Rd Unit A
- 204 N Cedar Rd
- 204 N Cedar Rd
- 201 E Maple St
- 125 E Maple St
- 225 E Maple St
- 120 Church St
- 208 E Maple St
- 215 S Cedar Rd
- 107 Church St
- 203 N Cedar Rd
- 114 N Cedar Rd
- 114 N Cedar Rd Unit 1
- 114 Church St
- 109 Hickory St
- 112 Church St
- 115 E Haven Ave
- 109 E Haven Ave