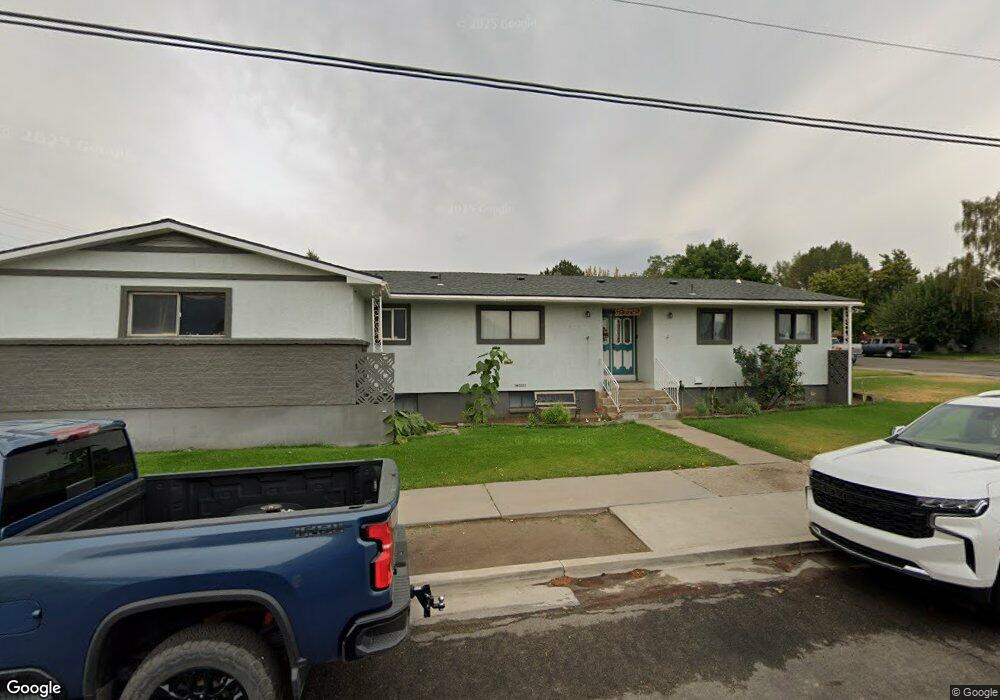
120 E Minor St Winnemucca, NV 89445
Estimated Value: $348,406 - $523,000
5
Beds
3
Baths
3,890
Sq Ft
$108/Sq Ft
Est. Value
About This Home
This home is located at 120 E Minor St, Winnemucca, NV 89445 and is currently estimated at $419,102, approximately $107 per square foot. 120 E Minor St is a home located in Humboldt County with nearby schools including Sonoma Heights Elementary School, French Ford Middle School, and Winnemucca Junior High School.
Ownership History
Date
Name
Owned For
Owner Type
Purchase Details
Closed on
May 20, 2021
Sold by
Brown Scot
Bought by
Frazier Maren W and Frazier Jessica F
Current Estimated Value
Home Financials for this Owner
Home Financials are based on the most recent Mortgage that was taken out on this home.
Original Mortgage
$239,580
Outstanding Balance
$215,264
Interest Rate
3.1%
Mortgage Type
FHA
Estimated Equity
$203,838
Purchase Details
Closed on
May 4, 2012
Sold by
Beloso Andrea and Beloso Brown Andrea
Bought by
Brown Scot
Purchase Details
Closed on
Jul 10, 2006
Sold by
Brown Scot
Bought by
Brown Sot and Beloso-Brown Andrea
Home Financials for this Owner
Home Financials are based on the most recent Mortgage that was taken out on this home.
Original Mortgage
$60,000
Interest Rate
6.57%
Mortgage Type
Credit Line Revolving
Create a Home Valuation Report for This Property
The Home Valuation Report is an in-depth analysis detailing your home's value as well as a comparison with similar homes in the area
Purchase History
| Date | Buyer | Sale Price | Title Company |
|---|---|---|---|
| Frazier Maren W | $244,000 | Stewart Title Company | |
| Brown Scot | -- | None Available | |
| Brown Sot | -- | -- |
Source: Public Records
Mortgage History
| Date | Status | Borrower | Loan Amount |
|---|---|---|---|
| Open | Frazier Maren W | $239,580 | |
| Previous Owner | Brown Sot | $60,000 |
Source: Public Records
Tax History
| Year | Tax Paid | Tax Assessment Tax Assessment Total Assessment is a certain percentage of the fair market value that is determined by local assessors to be the total taxable value of land and additions on the property. | Land | Improvement |
|---|---|---|---|---|
| 2025 | $1,579 | $55,303 | $12,425 | $42,878 |
| 2024 | $1,536 | $54,588 | $12,425 | $42,163 |
| 2023 | $1,536 | $49,088 | $10,325 | $38,763 |
| 2022 | $1,454 | $42,441 | $10,325 | $32,116 |
| 2021 | $1,427 | $41,589 | $10,325 | $31,264 |
| 2020 | $1,420 | $41,592 | $10,325 | $31,267 |
| 2019 | $1,374 | $39,924 | $10,325 | $29,599 |
| 2018 | $1,348 | $39,097 | $10,325 | $28,772 |
| 2017 | $1,330 | $38,540 | $10,325 | $28,215 |
| 2016 | $1,333 | $38,026 | $10,325 | $27,701 |
| 2015 | $1,282 | $37,270 | $10,325 | $26,945 |
| 2014 | $1,282 | $36,210 | $10,325 | $25,885 |
Source: Public Records
Map
Nearby Homes
- 1385 S Bridge St
- 1450 S Bridge St
- 160 Circle Dr
- 1767 Scott St
- 1362 Kodac St
- TBD E Haskell St
- 502 Prebble St
- 3205 N Sherwood Dr
- 5270 Marla Dr Unit 14
- 702 W Mcarthur Ave Unit 9
- 273 Mccoy St
- 3 Colado Ct
- 5248 Foothill Dr Unit 44
- 5252 Halter Way Unit 32
- 5254 Halter Way Unit 31
- 5256 Halter Way Unit 30
- 5258 Halter Way Unit 29
- 0 4th St Unit 230000686
- 5262 Halter Way Unit 28
- 5264 Halter Way Unit 27
- 1529 Harmony Rd
- 170 E Minor St
- 1551 Harmony Rd
- 1485 Harmony Rd
- 1410 Harmony Rd
- 1430 Harmony Rd
- 1518 Mizpah St
- 1565 Harmony Rd
- 1528 Mizpah St
- 1475 Harmony Rd
- 1550 Mizpah St
- 1490 Mizpah St
- 145 Arnold St
- 64 E Minor St
- 1564 Harmony Rd
- 1591 Harmony Rd
- 145 Arnold Ave
- 1445 Harmony Rd
- 175 Arnold Ave
- 175 Arnold St
Your Personal Tour Guide
Ask me questions while you tour the home.