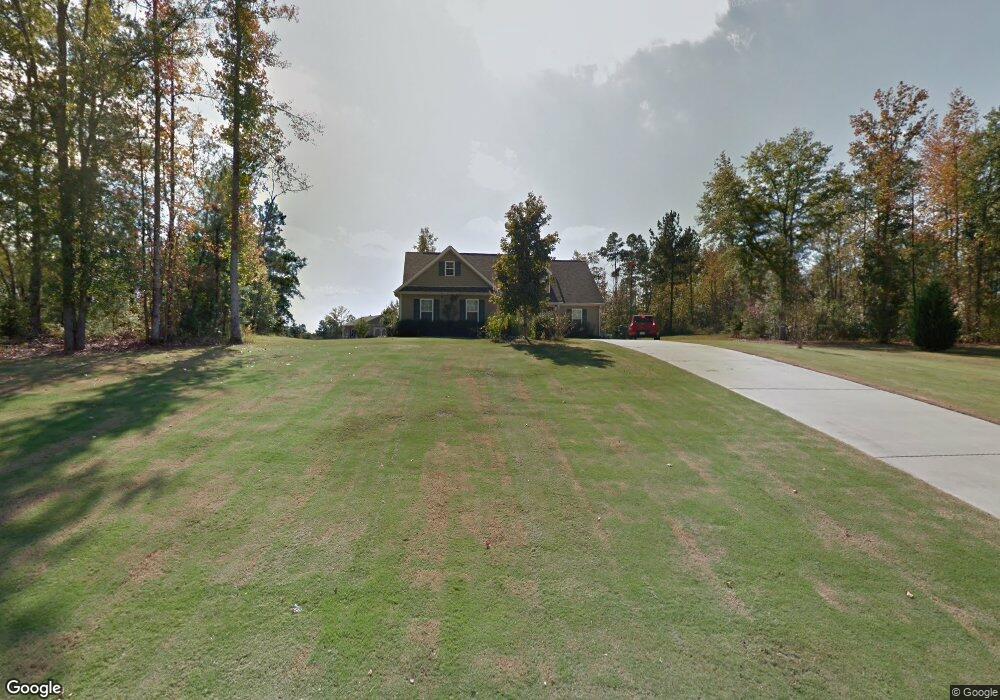
120 Farrington Ct Newnan, GA 30263
Estimated Value: $324,000 - $408,000
3
Beds
2
Baths
1,508
Sq Ft
$233/Sq Ft
Est. Value
About This Home
This home is located at 120 Farrington Ct, Newnan, GA 30263 and is currently estimated at $350,718, approximately $232 per square foot. 120 Farrington Ct is a home located in Coweta County with nearby schools including Atkinson Elementary School, Smokey Road Middle School, and Newnan High School.
Ownership History
Date
Name
Owned For
Owner Type
Purchase Details
Closed on
Sep 11, 2009
Sold by
Hanna Donald E and Hanna Virginia L
Bought by
Detmer Wyatt
Current Estimated Value
Home Financials for this Owner
Home Financials are based on the most recent Mortgage that was taken out on this home.
Original Mortgage
$110,000
Outstanding Balance
$71,940
Interest Rate
5.19%
Mortgage Type
New Conventional
Estimated Equity
$278,778
Purchase Details
Closed on
May 12, 2005
Sold by
Scott Neely Const Inc
Bought by
Hanna Virginia L
Home Financials for this Owner
Home Financials are based on the most recent Mortgage that was taken out on this home.
Original Mortgage
$154,085
Interest Rate
5.98%
Mortgage Type
New Conventional
Purchase Details
Closed on
Feb 2, 2005
Sold by
Robertson Carl A
Bought by
Scott Neely Construction Inc
Purchase Details
Closed on
Nov 30, 1986
Sold by
Robertson Carl A
Bought by
Robertson Carl A
Create a Home Valuation Report for This Property
The Home Valuation Report is an in-depth analysis detailing your home's value as well as a comparison with similar homes in the area
Home Values in the Area
Average Home Value in this Area
Purchase History
| Date | Buyer | Sale Price | Title Company |
|---|---|---|---|
| Detmer Wyatt | $148,000 | -- | |
| Hanna Virginia L | $154,100 | -- | |
| Scott Neely Construction Inc | $288,000 | -- | |
| Robertson Carl A | $202,000 | -- |
Source: Public Records
Mortgage History
| Date | Status | Borrower | Loan Amount |
|---|---|---|---|
| Open | Detmer Wyatt | $110,000 | |
| Previous Owner | Hanna Virginia L | $154,085 |
Source: Public Records
Tax History Compared to Growth
Tax History
| Year | Tax Paid | Tax Assessment Tax Assessment Total Assessment is a certain percentage of the fair market value that is determined by local assessors to be the total taxable value of land and additions on the property. | Land | Improvement |
|---|---|---|---|---|
| 2024 | $1,751 | $118,532 | $24,000 | $94,532 |
| 2023 | $1,751 | $111,199 | $20,000 | $91,199 |
| 2022 | $2,137 | $91,461 | $20,000 | $71,461 |
| 2021 | $1,808 | $73,353 | $12,000 | $61,353 |
| 2020 | $1,819 | $73,353 | $12,000 | $61,353 |
| 2019 | $1,965 | $71,956 | $16,000 | $55,956 |
| 2018 | $1,970 | $71,956 | $16,000 | $55,956 |
| 2017 | $1,904 | $69,724 | $12,000 | $57,724 |
| 2016 | $1,515 | $57,023 | $12,000 | $45,023 |
| 2015 | $1,492 | $57,023 | $12,000 | $45,023 |
| 2014 | $1,232 | $52,994 | $12,000 | $40,994 |
Source: Public Records
Map
Nearby Homes
- 46 Brandish Dr
- 1756 Millard Farmer Rd
- 23 Corn Crib Dr
- 23 Corn Crib Ct
- 110 Corn Row Ct
- 140 Beverly Park Ct
- 135 Widgeon Dr
- 1967 Corinth Rd
- 130 Mallard Dr
- 58 Bailey Dr
- LOT 1 Joe Roberts Rd
- LOT 3 Joe Roberts Rd
- 25 Bailey Dr
- 31 Festiva Dr
- 0 Meadowsweet Ln Unit 10582479
- 75 Davis McLendon Way
- 0 Smokey Rd Unit 10495165
- 0000 Smokey Rd
- 261 Lagrange St
- 765 E Newnan Rd
- 144 Farrington Ct
- 53 Brandish Dr
- 10 Brandish Dr
- 123 Farrington Ct
- 93 Farrington Ct Unit 21
- 93 Farrington Ct
- 24 Brandish Dr
- 158 Farrington Ct
- 34 Brandish Dr
- 0 Farrington Ct Unit 7355110
- 0 Farrington Ct Unit 8170395
- 0 Farrington Ct Unit 8059810
- 0 Farrington Ct Unit 7567070
- 0 Farrington Ct Unit 3193939
- 0 Farrington Ct Unit 7224496
- 0 Farrington Ct Unit 9027877
- 0 Farrington Ct Unit 7040526
- 77 Farrington Ct
- 86 Farrington Ct Unit A-68
- 86 Farrington Ct