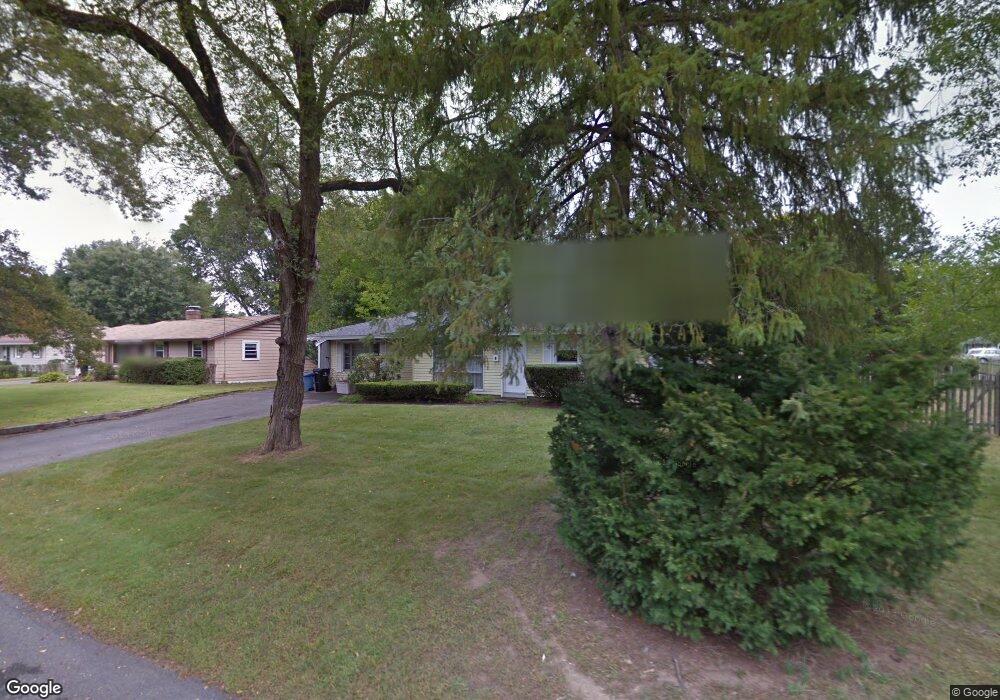
120 Fenwick St Framingham, MA 01701
Nobscot NeighborhoodEstimated Value: $525,000 - $608,000
3
Beds
1
Bath
1,636
Sq Ft
$344/Sq Ft
Est. Value
About This Home
This home is located at 120 Fenwick St, Framingham, MA 01701 and is currently estimated at $562,399, approximately $343 per square foot. 120 Fenwick St is a home located in Middlesex County with nearby schools including Framingham High School, MetroWest Jewish Day School, and Saint Bridget School.
Ownership History
Date
Name
Owned For
Owner Type
Purchase Details
Closed on
Oct 4, 2025
Sold by
Donovan Maura J
Bought by
Donovan Kerry M and Donovan Maura J
Current Estimated Value
Purchase Details
Closed on
Jul 16, 1997
Sold by
Olson John F and Couturier Marysusan
Bought by
Donovan Maura J
Home Financials for this Owner
Home Financials are based on the most recent Mortgage that was taken out on this home.
Original Mortgage
$129,600
Interest Rate
7.79%
Mortgage Type
Purchase Money Mortgage
Purchase Details
Closed on
Jun 30, 1987
Sold by
Tomassini Richard P
Bought by
Olson John F
Create a Home Valuation Report for This Property
The Home Valuation Report is an in-depth analysis detailing your home's value as well as a comparison with similar homes in the area
Home Values in the Area
Average Home Value in this Area
Purchase History
| Date | Buyer | Sale Price | Title Company |
|---|---|---|---|
| Donovan Kerry M | $125,000 | -- | |
| Donovan Maura J | $144,000 | -- | |
| Donovan Maura J | $144,000 | -- | |
| Olson John F | $153,000 | -- |
Source: Public Records
Mortgage History
| Date | Status | Borrower | Loan Amount |
|---|---|---|---|
| Previous Owner | Olson John F | $160,000 | |
| Previous Owner | Olson John F | $129,600 | |
| Previous Owner | Olson John F | $134,000 |
Source: Public Records
Tax History
| Year | Tax Paid | Tax Assessment Tax Assessment Total Assessment is a certain percentage of the fair market value that is determined by local assessors to be the total taxable value of land and additions on the property. | Land | Improvement |
|---|---|---|---|---|
| 2025 | $5,861 | $490,900 | $260,800 | $230,100 |
| 2024 | $5,540 | $444,600 | $232,900 | $211,700 |
| 2023 | $5,232 | $399,700 | $207,800 | $191,900 |
| 2022 | $4,951 | $360,300 | $188,600 | $171,700 |
| 2021 | $4,814 | $342,600 | $181,300 | $161,300 |
| 2020 | $4,815 | $321,400 | $164,700 | $156,700 |
| 2019 | $4,757 | $309,300 | $164,700 | $144,600 |
| 2018 | $4,671 | $286,200 | $158,600 | $127,600 |
| 2017 | $4,605 | $275,600 | $154,000 | $121,600 |
| 2016 | $4,522 | $260,200 | $154,000 | $106,200 |
| 2015 | $4,578 | $256,900 | $154,200 | $102,700 |
Source: Public Records
Map
Nearby Homes
- 102 Spruce St
- 111 Indian Head Rd
- 108 Cherry St
- 14 Ridgefield Dr
- 7 Ballydrain Rd
- 63 Kellogg St
- 36 Cider Mill Rd
- 227 Water St
- 484 Edgell Rd
- 337 Edgell Rd
- Lot 3 Murray Hill Rd
- 30 Donlon St
- 1376 Concord St
- 62 Central St
- 2 Chesterfield St
- 19 Park Ave
- 1 Harvard Rd
- 6 Woodward Rd
- 22 Debra Ln
- 46 Cochituate Rd Unit 106