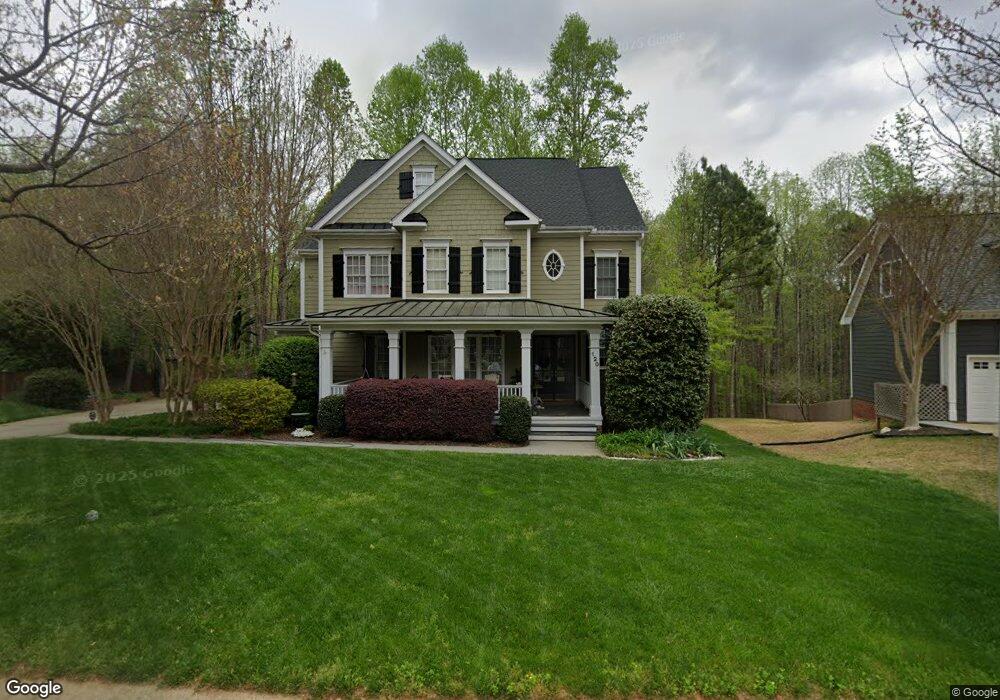
120 Flint Point Ln Holly Springs, NC 27540
Estimated Value: $897,000 - $968,000
5
Beds
5
Baths
3,824
Sq Ft
$246/Sq Ft
Est. Value
About This Home
This home is located at 120 Flint Point Ln, Holly Springs, NC 27540 and is currently estimated at $938,805, approximately $245 per square foot. 120 Flint Point Ln is a home located in Wake County with nearby schools including Holly Springs Elementary School, Holly Ridge Middle School, and Holly Springs High School.
Ownership History
Date
Name
Owned For
Owner Type
Purchase Details
Closed on
Jul 19, 2018
Sold by
Delp Aaron W and Delp Kimberly H
Bought by
Johnson Nathan Scott and Johnson Janna Lynette
Current Estimated Value
Home Financials for this Owner
Home Financials are based on the most recent Mortgage that was taken out on this home.
Original Mortgage
$437,750
Outstanding Balance
$379,376
Interest Rate
4.5%
Mortgage Type
New Conventional
Estimated Equity
$559,429
Purchase Details
Closed on
Jul 24, 2009
Sold by
Chereskin Dean E and Chereskin Shawn S
Bought by
Timberlake William T and Timberlake Joan P
Home Financials for this Owner
Home Financials are based on the most recent Mortgage that was taken out on this home.
Original Mortgage
$200,000
Interest Rate
5.36%
Mortgage Type
New Conventional
Purchase Details
Closed on
Dec 18, 2002
Sold by
Djf Builders Inc
Bought by
Chereskin Dean E and Chereskin Shawn S
Home Financials for this Owner
Home Financials are based on the most recent Mortgage that was taken out on this home.
Original Mortgage
$204,600
Interest Rate
6.07%
Purchase Details
Closed on
Nov 26, 2001
Sold by
Sunset Forest Llc
Bought by
Djf Builders Inc
Create a Home Valuation Report for This Property
The Home Valuation Report is an in-depth analysis detailing your home's value as well as a comparison with similar homes in the area
Home Values in the Area
Average Home Value in this Area
Purchase History
| Date | Buyer | Sale Price | Title Company |
|---|---|---|---|
| Johnson Nathan Scott | $515,000 | None Available | |
| Timberlake William T | $417,500 | None Available | |
| Chereskin Dean E | $347,000 | -- | |
| Djf Builders Inc | $106,000 | -- |
Source: Public Records
Mortgage History
| Date | Status | Borrower | Loan Amount |
|---|---|---|---|
| Open | Johnson Nathan Scott | $437,750 | |
| Previous Owner | Timberlake William T | $200,000 | |
| Previous Owner | Chereskin Dean E | $204,600 |
Source: Public Records
Tax History Compared to Growth
Tax History
| Year | Tax Paid | Tax Assessment Tax Assessment Total Assessment is a certain percentage of the fair market value that is determined by local assessors to be the total taxable value of land and additions on the property. | Land | Improvement |
|---|---|---|---|---|
| 2025 | $7,146 | $827,985 | $150,000 | $677,985 |
| 2024 | $7,116 | $827,985 | $150,000 | $677,985 |
| 2023 | $5,734 | $529,780 | $78,000 | $451,780 |
| 2022 | $5,536 | $529,780 | $78,000 | $451,780 |
| 2021 | $5,432 | $529,780 | $78,000 | $451,780 |
| 2020 | $5,432 | $529,780 | $78,000 | $451,780 |
| 2019 | $5,866 | $485,908 | $78,000 | $407,908 |
| 2018 | $0 | $485,908 | $78,000 | $407,908 |
| 2017 | $5,110 | $485,908 | $78,000 | $407,908 |
| 2016 | $4,487 | $432,417 | $78,000 | $354,417 |
| 2015 | $4,547 | $431,358 | $78,000 | $353,358 |
| 2014 | $4,390 | $431,358 | $78,000 | $353,358 |
Source: Public Records
Map
Nearby Homes
- 112 Midden Way
- 108 Warm Wood Ln
- 129 Starwood Ln
- 204 Crossway Ln
- 228 Masden Rd
- 0/416 Holly Springs Rd
- 204 Chrismill Ln
- 215 Savannah Ridge Rd Unit 215
- 305 Savannah Ridge Rd
- 225 Old Ride Dr
- 0 Old Ride Dr
- 208 Old Ride Dr
- 109 Willow View Ln
- 217 Jones Hill Rd
- 127 Willow View Ln
- 208 Apple Drupe Way
- 413 Rhamkatte Rd
- 100 Castien Cove Place
- 116 Cobblebrook Ct
- 201 Mayfield Dr
- 116 Flint Point Ln
- 124 Flint Point Ln
- 128 Flint Point Ln
- 112 Flint Point Ln
- 117 Flint Point Ln
- 113 Flint Point Ln
- 132 Flint Point Ln
- 108 Flint Point Ln
- 700 Crossway Ln
- 109 Flint Point Ln
- 221 Cliffcreek Dr
- 228 Cliffcreek Dr
- 125 Flint Point Ln
- 136 Flint Point Ln
- 104 Flint Point Ln
- 105 Flint Point Ln
- 612 Crossway Ln
- 616 Crossway Ln
- 608 Crossway Ln
- 140 Flint Point Ln