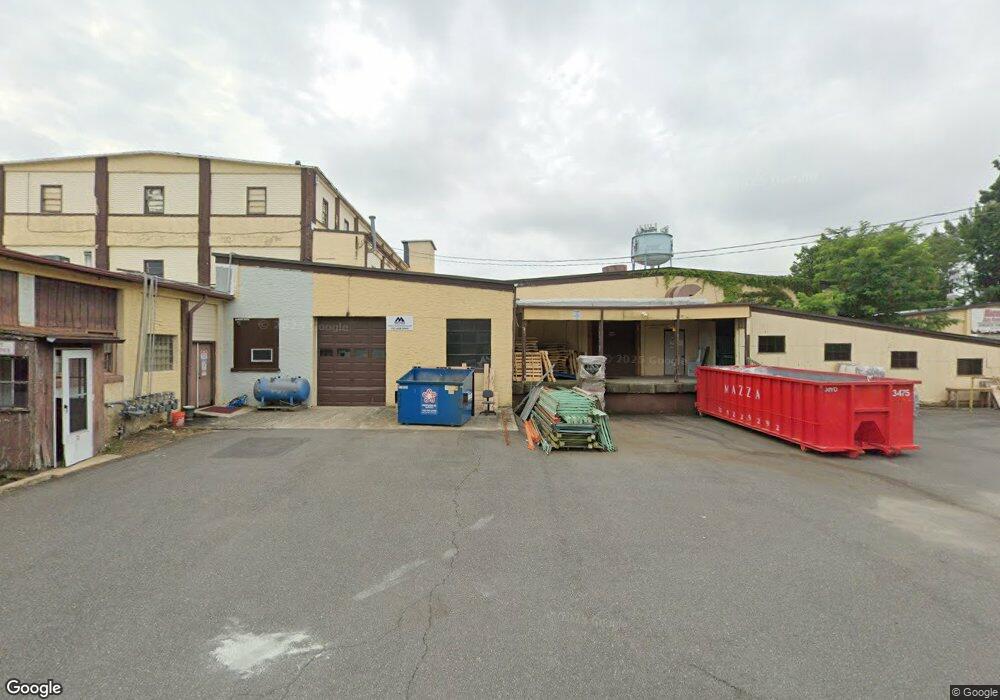
120 Francis St Keyport, NJ 07735
--
Bed
--
Bath
55,764
Sq Ft
--
Built
About This Home
This home is located at 120 Francis St, Keyport, NJ 07735. 120 Francis St is a home located in Monmouth County with nearby schools including Keyport Central School, Keyport High School, and Icob Academy.
Ownership History
Date
Name
Owned For
Owner Type
Purchase Details
Closed on
Sep 29, 2023
Sold by
Ap Francis Street Llc and C H A B Realty Llc
Bought by
Ap Francis Street De Llc and Chab Port Llc
Home Financials for this Owner
Home Financials are based on the most recent Mortgage that was taken out on this home.
Original Mortgage
$21,000,000
Outstanding Balance
$13,823,856
Interest Rate
7.18%
Mortgage Type
New Conventional
Purchase Details
Closed on
Feb 4, 2022
Sold by
Swift Family Partnership L P
Bought by
Modern Empire Incorporated
Create a Home Valuation Report for This Property
The Home Valuation Report is an in-depth analysis detailing your home's value as well as a comparison with similar homes in the area
Home Values in the Area
Average Home Value in this Area
Purchase History
| Date | Buyer | Sale Price | Title Company |
|---|---|---|---|
| Ap Francis Street De Llc | -- | Madison Title | |
| Ap Francis Street De Llc | -- | Madison Title | |
| Modern Empire Incorporated | $1,900,000 | Gale Jeffrey B | |
| Modern Empire Incorporated | $1,900,000 | Gale Jeffrey B |
Source: Public Records
Mortgage History
| Date | Status | Borrower | Loan Amount |
|---|---|---|---|
| Open | Ap Francis Street De Llc | $21,000,000 | |
| Closed | Ap Francis Street De Llc | $21,000,000 |
Source: Public Records
Tax History Compared to Growth
Tax History
| Year | Tax Paid | Tax Assessment Tax Assessment Total Assessment is a certain percentage of the fair market value that is determined by local assessors to be the total taxable value of land and additions on the property. | Land | Improvement |
|---|---|---|---|---|
| 2025 | $93,469 | $4,467,600 | $1,435,700 | $3,031,900 |
| 2024 | $62,276 | $4,380,000 | $1,367,400 | $3,012,600 |
| 2023 | $62,276 | $2,833,300 | $1,243,100 | $1,590,200 |
| 2022 | $68,925 | $2,833,300 | $1,080,900 | $1,752,400 |
| 2021 | $68,925 | $2,641,800 | $1,000,800 | $1,641,000 |
| 2020 | $74,459 | $2,833,300 | $953,200 | $1,880,100 |
| 2019 | $61,033 | $2,318,000 | $907,800 | $1,410,200 |
| 2018 | $62,238 | $2,318,000 | $907,800 | $1,410,200 |
| 2017 | $62,540 | $2,318,000 | $907,800 | $1,410,200 |
| 2016 | $61,543 | $2,318,000 | $907,800 | $1,410,200 |
| 2015 | $61,369 | $2,300,200 | $890,000 | $1,410,200 |
| 2014 | $58,956 | $2,228,100 | $956,800 | $1,271,300 |
Source: Public Records
Map
Nearby Homes
- 9 Monmouth Place
- 90 Saint Peters Place
- 127 Chingarora Ave
- 69 Maple Place
- 253 Broadway
- 8 Chingarora Ave
- 324 Maple Place
- 95 Broadway
- 1 Hobart St
- 52 Highway 35
- 362 Broadway
- 279 Washington St
- 116 Therese Ave
- 47 Village Green Way
- 226 Osborn St
- 231 Atlantic St Unit 23
- 195 Atlantic St
- 118 Village Green Way
- 22 Lower Main St
- 25-27 Brook Ave