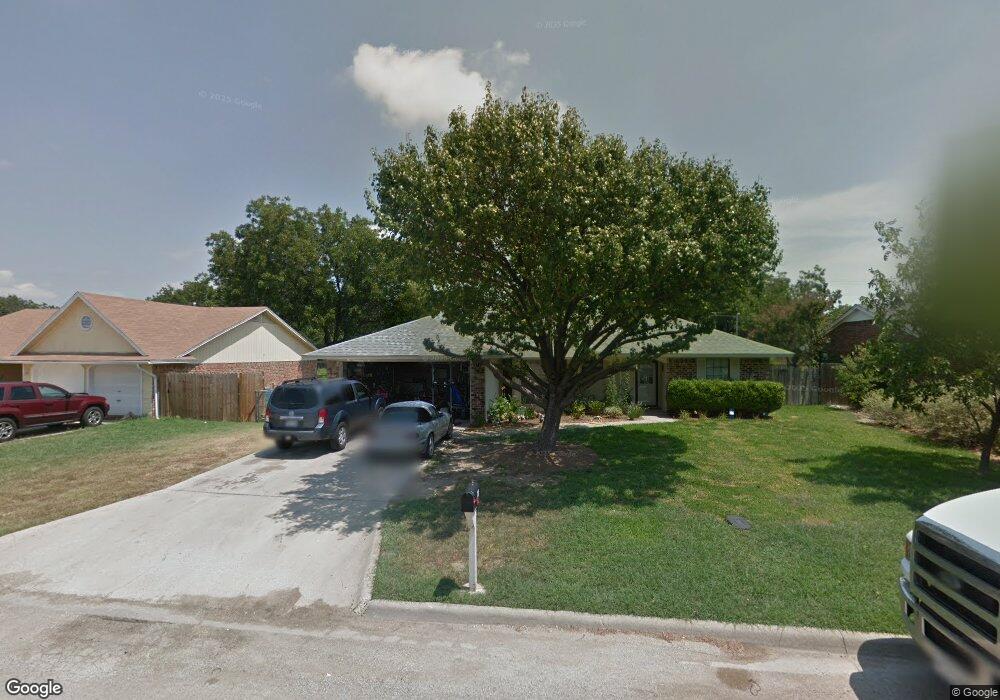
120 Freese Dr Sanger, TX 76266
Estimated Value: $232,000 - $263,000
3
Beds
2
Baths
1,280
Sq Ft
$194/Sq Ft
Est. Value
About This Home
This home is located at 120 Freese Dr, Sanger, TX 76266 and is currently estimated at $248,197, approximately $193 per square foot. 120 Freese Dr is a home located in Denton County with nearby schools including Chisholm Trail Elementary School, Clear Creek Intermediate School, and Sanger Sixth Grade Campus.
Ownership History
Date
Name
Owned For
Owner Type
Purchase Details
Closed on
Oct 17, 2019
Sold by
Corbin Chad and Corbin Rachel
Bought by
Nibroc Properties Llc
Current Estimated Value
Purchase Details
Closed on
Oct 30, 2008
Sold by
Lines Mary Ellen and Lines Lloyd David
Bought by
Corbin Chad and Corbin Rachel
Home Financials for this Owner
Home Financials are based on the most recent Mortgage that was taken out on this home.
Original Mortgage
$73,100
Interest Rate
6.08%
Mortgage Type
Purchase Money Mortgage
Purchase Details
Closed on
Jul 30, 1997
Sold by
Waggoner James E and Waggoner Susan Brooke
Bought by
Lines Lloyd Melvin and Lines Mary Ellen
Home Financials for this Owner
Home Financials are based on the most recent Mortgage that was taken out on this home.
Original Mortgage
$58,500
Interest Rate
7.59%
Create a Home Valuation Report for This Property
The Home Valuation Report is an in-depth analysis detailing your home's value as well as a comparison with similar homes in the area
Home Values in the Area
Average Home Value in this Area
Purchase History
| Date | Buyer | Sale Price | Title Company |
|---|---|---|---|
| Nibroc Properties Llc | -- | None Available | |
| Corbin Chad | -- | Title Resources | |
| Lines Lloyd Melvin | -- | -- |
Source: Public Records
Mortgage History
| Date | Status | Borrower | Loan Amount |
|---|---|---|---|
| Closed | Corbin Chad | $73,100 | |
| Previous Owner | Lines Lloyd Melvin | $58,500 |
Source: Public Records
Tax History Compared to Growth
Tax History
| Year | Tax Paid | Tax Assessment Tax Assessment Total Assessment is a certain percentage of the fair market value that is determined by local assessors to be the total taxable value of land and additions on the property. | Land | Improvement |
|---|---|---|---|---|
| 2025 | $4,648 | $210,900 | $63,788 | $147,112 |
| 2024 | $4,648 | $230,000 | $63,788 | $166,212 |
| 2023 | $5,168 | $255,000 | $63,788 | $191,212 |
| 2022 | $4,258 | $192,000 | $44,063 | $147,937 |
| 2021 | $3,258 | $155,000 | $44,063 | $110,937 |
| 2020 | $3,330 | $150,495 | $31,284 | $119,211 |
| 2019 | $2,846 | $125,000 | $31,284 | $93,716 |
| 2018 | $2,632 | $115,000 | $31,284 | $83,716 |
| 2017 | $2,300 | $100,000 | $29,963 | $70,037 |
| 2016 | $2,070 | $90,000 | $28,641 | $61,359 |
| 2015 | $1,882 | $85,000 | $28,641 | $56,359 |
| 2013 | -- | $79,000 | $28,641 | $50,359 |
Source: Public Records
Map
Nearby Homes
- 113 Diane Dr
- 212 Diane Dr
- 226 Hillcrest St
- 109 Colonial Heights
- 505 Houston St
- 209 Southland Dr
- 202 Southland Dr
- 319 Austin St
- 509 Marshall St
- 710 W Willow St
- 124 Morning Glory
- 130 Southside Dr
- 411 Hughes St
- 109 S 5th St
- 2000 S Stemmons St
- 1010 Bolivar St
- 321 Quail Crossing Dr
- 185 Aster Dr
- 319 Quail Crossing Dr
- 2004 S Stemmons St
- 122 Freese Dr
- 118 Freese Dr
- 116 Freese Dr
- 124 Freese Dr
- 115 Kathryn Dr
- 201 Kathryn Dr
- 113 Kathryn Dr
- 114 Freese Dr
- 0 Spur 138 & Freese Dr Corner NE
- 205 Kathryn Dr
- 111 Kathryn Dr
- 112 Freese Dr
- 207 David Dr
- 128 Freese Dr
- 109 Kathryn Dr
- 205 David Dr
- 110 Freese Dr
- 209 David Dr
- 112 Kathryn Dr
- 200 Kathryn Dr