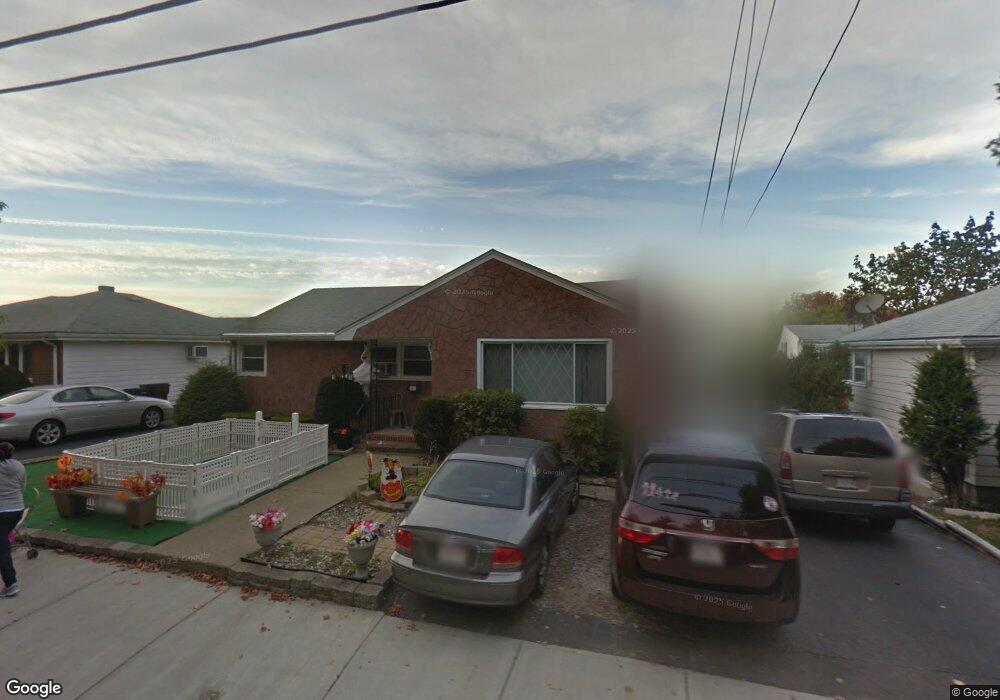
120 Fuller St Everett, MA 02149
Glendale NeighborhoodEstimated Value: $632,000 - $793,000
4
Beds
2
Baths
1,164
Sq Ft
$612/Sq Ft
Est. Value
About This Home
This home is located at 120 Fuller St, Everett, MA 02149 and is currently estimated at $712,111, approximately $611 per square foot. 120 Fuller St is a home located in Middlesex County with nearby schools including Everett High School, Pioneer Charter School of Science, and Malden Catholic.
Ownership History
Date
Name
Owned For
Owner Type
Purchase Details
Closed on
Mar 30, 2012
Sold by
Goss-Johnson Barbarann
Bought by
Goss-Johnson Barbarann and Vidal Ramona
Current Estimated Value
Purchase Details
Closed on
Aug 30, 1991
Sold by
Cintolo Robert J and Cintolo Ann-Marie B
Bought by
Goss-Johnson Barbarann
Home Financials for this Owner
Home Financials are based on the most recent Mortgage that was taken out on this home.
Original Mortgage
$123,750
Interest Rate
9.44%
Mortgage Type
Purchase Money Mortgage
Purchase Details
Closed on
May 19, 1988
Sold by
Cintolo Carmen
Bought by
Cintolo Robert J
Home Financials for this Owner
Home Financials are based on the most recent Mortgage that was taken out on this home.
Original Mortgage
$85,000
Interest Rate
10.13%
Mortgage Type
Purchase Money Mortgage
Create a Home Valuation Report for This Property
The Home Valuation Report is an in-depth analysis detailing your home's value as well as a comparison with similar homes in the area
Home Values in the Area
Average Home Value in this Area
Purchase History
| Date | Buyer | Sale Price | Title Company |
|---|---|---|---|
| Goss-Johnson Barbarann | -- | -- | |
| Goss-Johnson Barbarann | $165,000 | -- | |
| Cintolo Robert J | $145,000 | -- |
Source: Public Records
Mortgage History
| Date | Status | Borrower | Loan Amount |
|---|---|---|---|
| Previous Owner | Cintolo Robert J | $123,750 | |
| Previous Owner | Cintolo Robert J | $85,000 |
Source: Public Records
Tax History
| Year | Tax Paid | Tax Assessment Tax Assessment Total Assessment is a certain percentage of the fair market value that is determined by local assessors to be the total taxable value of land and additions on the property. | Land | Improvement |
|---|---|---|---|---|
| 2025 | $6,367 | $559,000 | $230,000 | $329,000 |
| 2024 | $6,107 | $532,900 | $230,000 | $302,900 |
| 2023 | $5,972 | $507,000 | $220,000 | $287,000 |
| 2022 | $5,033 | $485,800 | $210,000 | $275,800 |
| 2021 | $4,373 | $443,100 | $188,000 | $255,100 |
| 2020 | $4,631 | $435,200 | $188,000 | $247,200 |
| 2019 | $4,948 | $399,700 | $179,000 | $220,700 |
| 2018 | $4,983 | $361,600 | $168,000 | $193,600 |
| 2017 | $4,628 | $320,500 | $140,000 | $180,500 |
| 2016 | $4,351 | $301,100 | $125,000 | $176,100 |
| 2015 | $4,178 | $286,000 | $112,800 | $173,200 |
Source: Public Records
Map
Nearby Homes
Your Personal Tour Guide
Ask me questions while you tour the home.