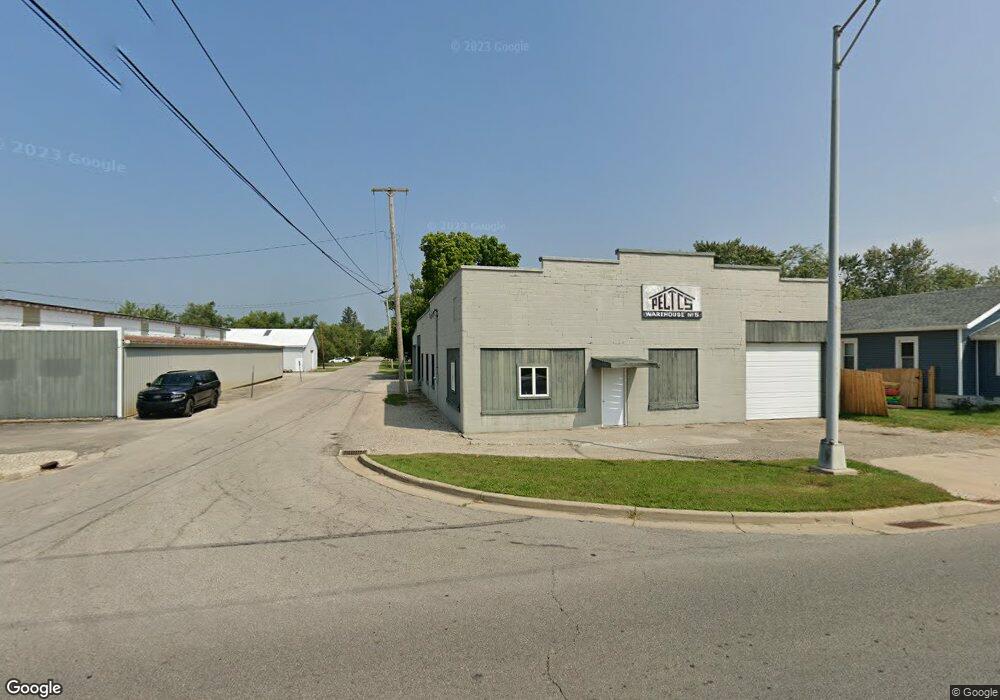
120 Fulton Rd Montpelier, OH 43543
Estimated Value: $83,000 - $120,000
2
Beds
1
Bath
576
Sq Ft
$164/Sq Ft
Est. Value
About This Home
This home is located at 120 Fulton Rd, Montpelier, OH 43543 and is currently estimated at $94,354, approximately $163 per square foot. 120 Fulton Rd is a home located in Williams County with nearby schools including Montpelier Elementary School and Montpelier High School.
Ownership History
Date
Name
Owned For
Owner Type
Purchase Details
Closed on
Jan 16, 2019
Sold by
Henderson Rodney L
Bought by
Henderson Barbara A and Henderson Barbara Ann
Current Estimated Value
Purchase Details
Closed on
Dec 17, 2015
Sold by
Henderson Rodney L and Henderson Barbara Ann
Bought by
Henderson Rodney L and Henderson Barbara Ann
Purchase Details
Closed on
Dec 16, 2006
Sold by
Walkup Stacey J and Walkup Robert
Bought by
Treesh Cherie E and Anderson Cherie Elaine
Home Financials for this Owner
Home Financials are based on the most recent Mortgage that was taken out on this home.
Original Mortgage
$38,400
Outstanding Balance
$24,161
Interest Rate
7.37%
Mortgage Type
Adjustable Rate Mortgage/ARM
Estimated Equity
$70,193
Purchase Details
Closed on
Nov 15, 2001
Sold by
Walkup Stacey J
Bought by
Walkup
Purchase Details
Closed on
Dec 23, 1997
Sold by
Zenz Scot E
Bought by
Zenz Steven L
Purchase Details
Closed on
Sep 4, 1991
Bought by
Zenz Jack D Janet J
Create a Home Valuation Report for This Property
The Home Valuation Report is an in-depth analysis detailing your home's value as well as a comparison with similar homes in the area
Home Values in the Area
Average Home Value in this Area
Purchase History
| Date | Buyer | Sale Price | Title Company |
|---|---|---|---|
| Henderson Barbara A | -- | None Available | |
| Henderson Rodney L | -- | None Available | |
| Treesh Cherie E | $45,000 | None Available | |
| Walkup | $45,000 | -- | |
| Zenz Steven L | $30,000 | -- | |
| Zenz Jack D Janet J | $31,500 | -- |
Source: Public Records
Mortgage History
| Date | Status | Borrower | Loan Amount |
|---|---|---|---|
| Open | Treesh Cherie E | $38,400 |
Source: Public Records
Tax History Compared to Growth
Tax History
| Year | Tax Paid | Tax Assessment Tax Assessment Total Assessment is a certain percentage of the fair market value that is determined by local assessors to be the total taxable value of land and additions on the property. | Land | Improvement |
|---|---|---|---|---|
| 2024 | $846 | $24,820 | $3,080 | $21,740 |
| 2023 | $846 | $11,630 | $3,120 | $8,510 |
| 2022 | $441 | $11,630 | $3,120 | $8,510 |
| 2021 | $441 | $11,630 | $3,120 | $8,510 |
| 2020 | $401 | $10,090 | $2,700 | $7,390 |
| 2019 | $406 | $10,090 | $2,700 | $7,390 |
| 2018 | $203 | $10,090 | $2,700 | $7,390 |
| 2017 | $370 | $9,210 | $2,700 | $6,510 |
| 2016 | $359 | $9,210 | $2,700 | $6,510 |
| 2015 | $368 | $9,210 | $2,700 | $6,510 |
| 2014 | $368 | $9,210 | $2,700 | $6,510 |
| 2013 | $373 | $9,210 | $2,700 | $6,510 |
Source: Public Records
Map
Nearby Homes
- 620 E Washington St
- 426 E Water St
- 1454 Whitaker Way
- 500 E Court St
- 212 S Pleasant St
- 612 S Pleasant St
- 420 Steuben St
- 402 Empire St
- 13 W Brown Rd
- 00 W Brown Rd
- 0 John Ave Unit 6131803
- 0 Frank St
- 1413 Maplehurst Ave
- 1401 Maplehurst Ave
- 1533 Maplehurst Ave
- 1529 Maplehurst Ave
- 1525 Maplehurst Ave
- 1521 Maplehurst Ave
- 802 W Brown Rd
- 9701 State Route 107