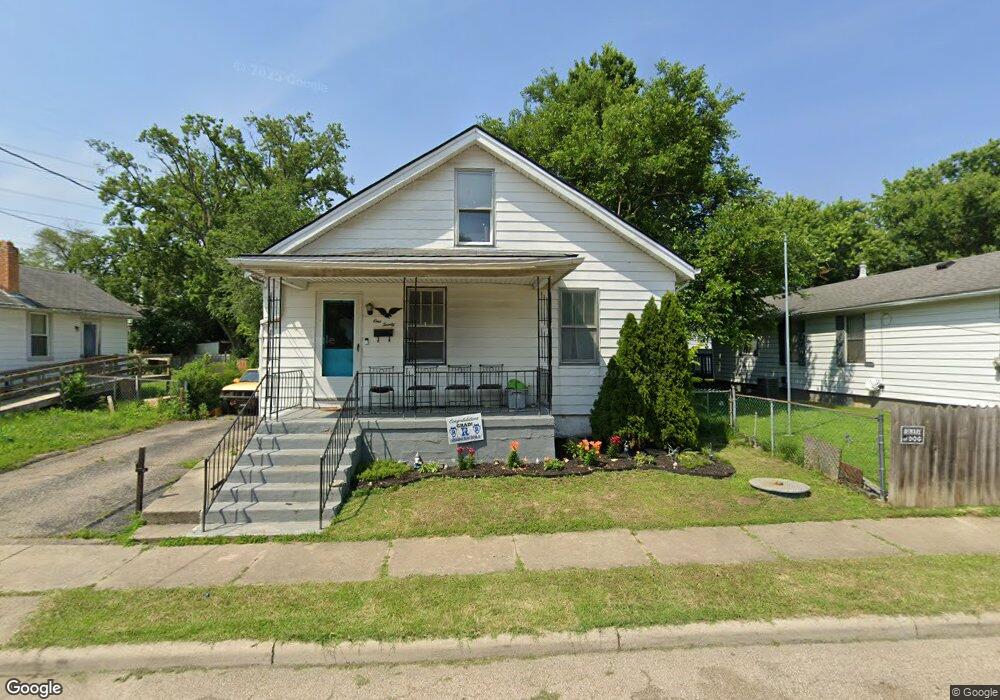
120 Gebert St Cincinnati, OH 45215
Estimated Value: $153,000 - $178,000
4
Beds
1
Bath
1,243
Sq Ft
$133/Sq Ft
Est. Value
About This Home
This home is located at 120 Gebert St, Cincinnati, OH 45215 and is currently estimated at $164,815, approximately $132 per square foot. 120 Gebert St is a home located in Hamilton County with nearby schools including Reading Community High School, Saints Peter and Paul Academy, and Mount Notre Dame High School.
Ownership History
Date
Name
Owned For
Owner Type
Purchase Details
Closed on
Oct 18, 2017
Sold by
Caldwell Gregory and Caldwell Greg P
Bought by
Caldwell Kristy and Caldwell Kristy L
Current Estimated Value
Purchase Details
Closed on
Aug 20, 2003
Sold by
Caldwell Gregory and Caldwell Kristy
Bought by
Caldwell Gregory and Caldwell Kristy
Home Financials for this Owner
Home Financials are based on the most recent Mortgage that was taken out on this home.
Original Mortgage
$75,500
Interest Rate
5.69%
Mortgage Type
Unknown
Purchase Details
Closed on
Jan 2, 2002
Sold by
Berry Robert W and Harper Brenda G
Bought by
Caldwell Greg and Caldwell Gregory
Home Financials for this Owner
Home Financials are based on the most recent Mortgage that was taken out on this home.
Original Mortgage
$75,150
Interest Rate
6.92%
Purchase Details
Closed on
Feb 15, 2001
Sold by
Estate Of Imogene Berry
Bought by
Berry Robert W and Harper Brenda G
Create a Home Valuation Report for This Property
The Home Valuation Report is an in-depth analysis detailing your home's value as well as a comparison with similar homes in the area
Home Values in the Area
Average Home Value in this Area
Purchase History
| Date | Buyer | Sale Price | Title Company |
|---|---|---|---|
| Caldwell Kristy | -- | None Available | |
| Caldwell Gregory | -- | Express Title Service | |
| Caldwell Greg | $77,500 | Mid America Land Title Agenc | |
| Berry Robert W | -- | -- |
Source: Public Records
Mortgage History
| Date | Status | Borrower | Loan Amount |
|---|---|---|---|
| Closed | Caldwell Gregory | $75,500 | |
| Previous Owner | Caldwell Greg | $75,150 |
Source: Public Records
Tax History
| Year | Tax Paid | Tax Assessment Tax Assessment Total Assessment is a certain percentage of the fair market value that is determined by local assessors to be the total taxable value of land and additions on the property. | Land | Improvement |
|---|---|---|---|---|
| 2025 | $1,905 | $35,826 | $8,827 | $26,999 |
| 2024 | $1,865 | $35,826 | $8,827 | $26,999 |
| 2023 | $1,889 | $35,826 | $8,827 | $26,999 |
| 2022 | $1,618 | $23,748 | $7,098 | $16,650 |
| 2021 | $1,356 | $23,748 | $7,098 | $16,650 |
| 2020 | $1,365 | $23,748 | $7,098 | $16,650 |
| 2019 | $1,325 | $21,018 | $6,283 | $14,735 |
| 2018 | $1,326 | $21,018 | $6,283 | $14,735 |
| 2017 | $1,253 | $21,018 | $6,283 | $14,735 |
| 2016 | $1,531 | $25,824 | $6,654 | $19,170 |
| 2015 | $1,542 | $25,824 | $6,654 | $19,170 |
| 2014 | $1,350 | $25,824 | $6,654 | $19,170 |
| 2013 | $1,368 | $26,352 | $6,790 | $19,562 |
Source: Public Records
Map
Nearby Homes
- 321 Southern Ave
- 311 Southern Ave
- 653 Harmes Ave
- 415 Arlington Ave
- 20 Clark Rd
- 654 3rd St
- 129 Pike St
- 334 Williams St
- 0 Hill St Unit 1616370
- 329 Walnut St
- 134 Walnut St
- 529 Elliott Ave
- 310 E Vine St
- 1401 Jefferson Ave
- 2281 E Galbraith Rd
- 217 W Wyoming Ave
- 1421 Jefferson Ave
- 636 Maple Dr
- 1521 Hunt Rd
- 8338 Anthony Wayne Ave
Your Personal Tour Guide
Ask me questions while you tour the home.