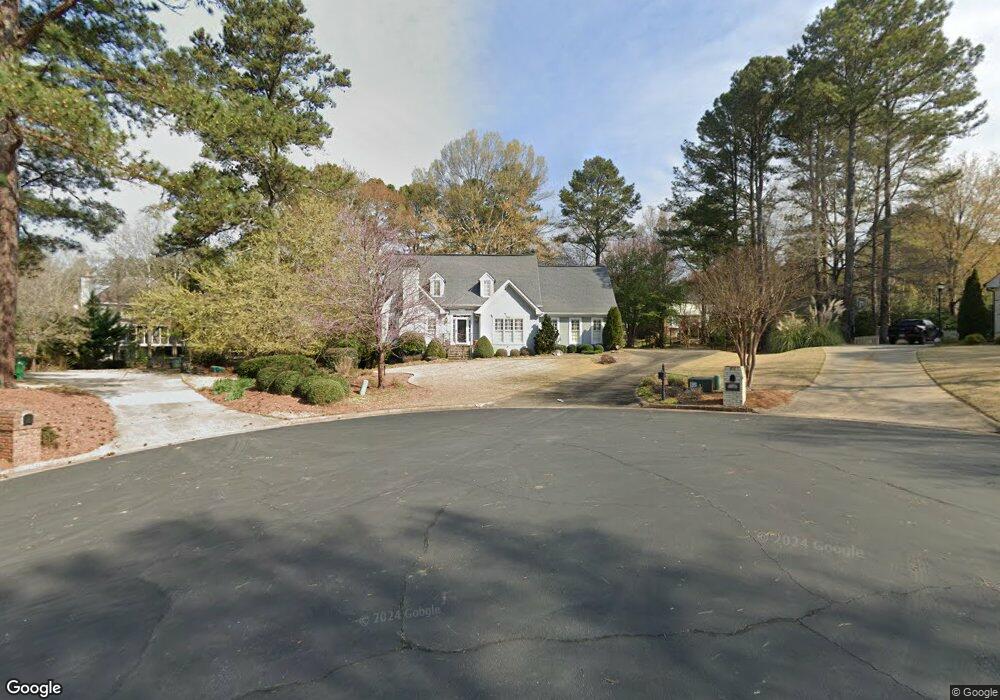
120 Gingergate Ct Alpharetta, GA 30022
Doublegate NeighborhoodEstimated Value: $757,402 - $889,000
3
Beds
3
Baths
2,484
Sq Ft
$326/Sq Ft
Est. Value
About This Home
This home is located at 120 Gingergate Ct, Alpharetta, GA 30022 and is currently estimated at $809,601, approximately $325 per square foot. 120 Gingergate Ct is a home located in Fulton County with nearby schools including State Bridge Crossing Elementary School, Autrey Mill Middle School, and Johns Creek High School.
Ownership History
Date
Name
Owned For
Owner Type
Purchase Details
Closed on
May 14, 2015
Sold by
Pittroff Dorothy H
Bought by
Pittroff William F and Pittroff Dorothy H
Current Estimated Value
Purchase Details
Closed on
May 3, 2002
Sold by
Pittroff William F
Bought by
Pittroff Dorothy H
Create a Home Valuation Report for This Property
The Home Valuation Report is an in-depth analysis detailing your home's value as well as a comparison with similar homes in the area
Home Values in the Area
Average Home Value in this Area
Purchase History
| Date | Buyer | Sale Price | Title Company |
|---|---|---|---|
| Pittroff William F | -- | -- | |
| Pittroff Dorothy H | -- | -- |
Source: Public Records
Tax History Compared to Growth
Tax History
| Year | Tax Paid | Tax Assessment Tax Assessment Total Assessment is a certain percentage of the fair market value that is determined by local assessors to be the total taxable value of land and additions on the property. | Land | Improvement |
|---|---|---|---|---|
| 2025 | $4,249 | $303,320 | $114,280 | $189,040 |
| 2023 | $6,110 | $216,480 | $50,200 | $166,280 |
| 2022 | $4,205 | $199,840 | $44,720 | $155,120 |
| 2021 | $4,150 | $171,320 | $46,760 | $124,560 |
| 2020 | $4,166 | $163,240 | $51,560 | $111,680 |
| 2019 | $477 | $148,000 | $46,520 | $101,480 |
| 2018 | $4,147 | $144,520 | $45,400 | $99,120 |
| 2017 | $4,303 | $144,360 | $45,400 | $98,960 |
| 2016 | $4,220 | $144,760 | $38,720 | $106,040 |
| 2015 | $4,256 | $144,760 | $38,720 | $106,040 |
| 2014 | -- | $129,320 | $32,960 | $96,360 |
Source: Public Records
Map
Nearby Homes
- 5255 Buice Rd
- The Ellington Plan at Ward's Crossing
- The Jacobsen I Plan at Ward's Crossing
- The Jacobsen II Plan at Ward's Crossing
- The Benton III Plan at Ward's Crossing
- 606 Goldsmith Ct Unit 114
- 602 Goldsmith Ct Unit 116
- 608 Goldsmith Ct Unit 113
- 1019 Crown Oak St Unit 51
- 504 Winston Croft Cir Unit 54
- 200 Wheatland Rd
- 153 Wards Crossing Way Unit 8
- 153 Wards Crossing Way
- 149 Wards Crossing Way Unit 10
- 149 Wards Crossing Way
- 1011 Crown Oak St Unit 47
- 1017 Crown Oak St Unit 50
- 1007 Crown Oak St Unit 45
- 510 Winston Croft Cir Unit 56
- 1003 Crown Oak St Unit 43
- 130 Gingergate Ct
- 9955 Twingate Dr
- 110 Gingergate Ct
- 9965 Twingate Dr Unit III
- 9945 Twingate Dr
- 9975 Twingate Dr Unit 3
- 9935 Twingate Dr
- 155 Gingergate Ct
- 655 Wintergate Ct
- 145 Gingergate Ct
- 100 Gingergate Ct
- 640 Wintergate Ct Unit 4
- 9985 Twingate Dr
- 135 Gingergate Ct Unit 3
- 9980 Twingate Dr
- 125 Gingergate Ct
- 645 Wintergate Ct
- 9960 Twingate Dr
- 9990 Twingate Dr
- 115 Gingergate Ct