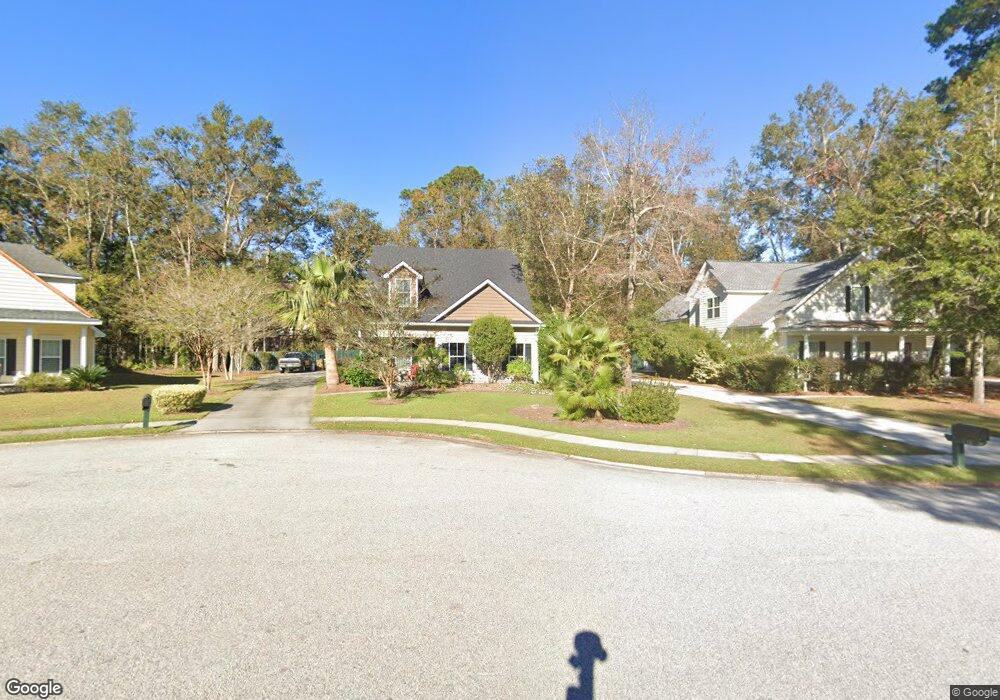
120 Golden Rod Loop Richmond Hill, GA 31324
Estimated Value: $418,412 - $462,000
4
Beds
3
Baths
2,364
Sq Ft
$183/Sq Ft
Est. Value
About This Home
This home is located at 120 Golden Rod Loop, Richmond Hill, GA 31324 and is currently estimated at $432,603, approximately $182 per square foot. 120 Golden Rod Loop is a home located in Bryan County with nearby schools including Richmond Hill Primary School, Dr. George Washington Carver Elementary School, and Richmond Hill Elementary School.
Ownership History
Date
Name
Owned For
Owner Type
Purchase Details
Closed on
Mar 21, 2011
Sold by
Synergy Designer Homes Inc
Bought by
Marciniak Thomas A and Marciniak Michelle B
Current Estimated Value
Home Financials for this Owner
Home Financials are based on the most recent Mortgage that was taken out on this home.
Original Mortgage
$246,241
Outstanding Balance
$168,873
Interest Rate
4.75%
Mortgage Type
FHA
Estimated Equity
$263,730
Purchase Details
Closed on
Dec 13, 2010
Sold by
Olde South Construction Llc
Bought by
Synergy Designer Homes Inc
Home Financials for this Owner
Home Financials are based on the most recent Mortgage that was taken out on this home.
Original Mortgage
$196,431
Interest Rate
4.18%
Mortgage Type
Construction
Purchase Details
Closed on
Jul 13, 2007
Bought by
Olde South Construction Llc
Create a Home Valuation Report for This Property
The Home Valuation Report is an in-depth analysis detailing your home's value as well as a comparison with similar homes in the area
Home Values in the Area
Average Home Value in this Area
Purchase History
| Date | Buyer | Sale Price | Title Company |
|---|---|---|---|
| Marciniak Thomas A | $255,175 | -- | |
| Synergy Designer Homes Inc | $55,000 | -- | |
| Olde South Construction Llc | $55,100 | -- |
Source: Public Records
Mortgage History
| Date | Status | Borrower | Loan Amount |
|---|---|---|---|
| Open | Marciniak Thomas A | $246,241 | |
| Previous Owner | Synergy Designer Homes Inc | $196,431 |
Source: Public Records
Tax History Compared to Growth
Tax History
| Year | Tax Paid | Tax Assessment Tax Assessment Total Assessment is a certain percentage of the fair market value that is determined by local assessors to be the total taxable value of land and additions on the property. | Land | Improvement |
|---|---|---|---|---|
| 2024 | $3,923 | $146,600 | $32,000 | $114,600 |
| 2023 | $3,923 | $142,760 | $32,000 | $110,760 |
| 2022 | $3,313 | $118,920 | $32,000 | $86,920 |
| 2021 | $2,994 | $107,280 | $32,000 | $75,280 |
| 2020 | $3,009 | $103,680 | $32,000 | $71,680 |
| 2019 | $2,842 | $100,600 | $30,800 | $69,800 |
| 2018 | $2,674 | $100,600 | $30,800 | $69,800 |
| 2017 | $2,637 | $105,840 | $36,000 | $69,840 |
| 2016 | $2,619 | $104,480 | $36,000 | $68,480 |
| 2015 | $2,603 | $103,000 | $36,000 | $67,000 |
| 2014 | $2,627 | $103,680 | $36,000 | $67,680 |
Source: Public Records
Map
Nearby Homes
- 75 Golden Rod Loop
- 128 Landing Way
- 22 Sterling Creek Dr
- 77 Whitaker Way N
- 30 Cantle Dr
- 210 Kepler Loop
- 345 Cantle Dr
- 355 Cantle Dr
- 39 Cat Tail Ct
- 100 Glen Way
- 420 Cantle Dr
- 155 Alexander Way
- 28 Cypress Pointe Dr
- 125 Cypress Pointe Dr
- 95 Glen Way
- 25 Glen Way
- 7 Sailmaker Ln
- 620 Bristol Way
- 204 Dogwood Way
- 224 Dogwood Way
- 110 Golden Rod Loop
- 130 Golden Rod Loop
- 100 Golden Rod Loop
- 115 Golden Rod Loop
- 95 Golden Rod Loop
- 105 Golden Rod Loop
- 223 Ball Park Rd
- 85 Golden Rod Loop
- 80 Golden Rod Loop
- 252 Cottonham Ct
- 258 Cottonham Ct
- 80 Teachers Row
- 90 Teachers Row
- 70 Teachers Row
- 674 Timber Trail
- 60 Teachers Row
- 267 Cottonham Ct
- 70 Golden Rod Loop
- 65 Golden Rod Loop
- 244 Cottonham Ct