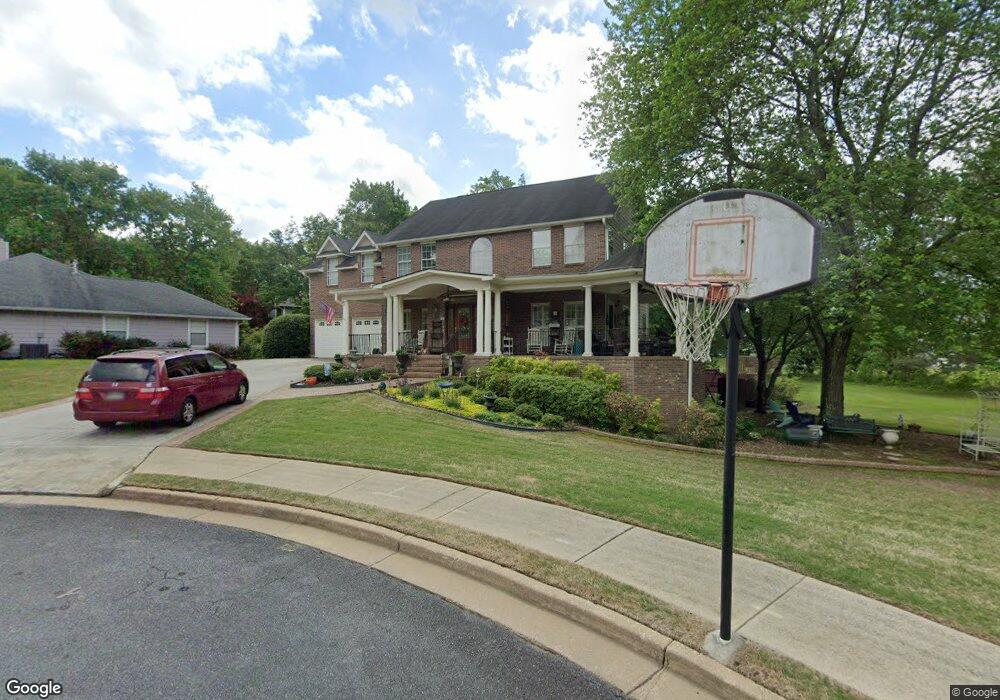
120 Greenmont Downs Trace Unit 1 Alpharetta, GA 30009
Estimated Value: $596,000 - $827,000
4
Beds
3
Baths
2,861
Sq Ft
$251/Sq Ft
Est. Value
About This Home
This home is located at 120 Greenmont Downs Trace Unit 1, Alpharetta, GA 30009 and is currently estimated at $719,037, approximately $251 per square foot. 120 Greenmont Downs Trace Unit 1 is a home located in Fulton County with nearby schools including Alpharetta Elementary School, Northwestern Middle School, and Milton High School.
Ownership History
Date
Name
Owned For
Owner Type
Purchase Details
Closed on
Jul 16, 2004
Sold by
Regan Eric S and Regan Rhonda
Bought by
Regan Eric S and Regan Rhonda
Current Estimated Value
Home Financials for this Owner
Home Financials are based on the most recent Mortgage that was taken out on this home.
Original Mortgage
$110,000
Interest Rate
6.24%
Mortgage Type
New Conventional
Purchase Details
Closed on
Jun 2, 1998
Sold by
Weekley J Wade and Weekley Virginia
Bought by
Rosenthal Michael and Rosenthal Kimberly
Home Financials for this Owner
Home Financials are based on the most recent Mortgage that was taken out on this home.
Original Mortgage
$146,000
Interest Rate
7.15%
Mortgage Type
New Conventional
Purchase Details
Closed on
Mar 31, 1995
Sold by
Lee David L Lisa R
Bought by
Weekley J Wade Virginia
Create a Home Valuation Report for This Property
The Home Valuation Report is an in-depth analysis detailing your home's value as well as a comparison with similar homes in the area
Home Values in the Area
Average Home Value in this Area
Purchase History
| Date | Buyer | Sale Price | Title Company |
|---|---|---|---|
| Regan Eric S | $253,500 | -- | |
| Regan Eric S | -- | -- | |
| Rosenthal Michael | $182,500 | -- | |
| Weekley J Wade Virginia | $150,000 | -- |
Source: Public Records
Mortgage History
| Date | Status | Borrower | Loan Amount |
|---|---|---|---|
| Closed | Regan Eric S | $110,000 | |
| Closed | Regan Eric S | $103,000 | |
| Previous Owner | Rosenthal Michael | $146,000 | |
| Closed | Weekley J Wade Virginia | $0 |
Source: Public Records
Tax History Compared to Growth
Tax History
| Year | Tax Paid | Tax Assessment Tax Assessment Total Assessment is a certain percentage of the fair market value that is determined by local assessors to be the total taxable value of land and additions on the property. | Land | Improvement |
|---|---|---|---|---|
| 2025 | $335 | $246,920 | $53,960 | $192,960 |
| 2023 | $6,259 | $221,760 | $46,720 | $175,040 |
| 2022 | $853 | $198,640 | $34,320 | $164,320 |
| 2021 | $2,848 | $171,800 | $25,760 | $146,040 |
| 2020 | $2,858 | $165,360 | $28,360 | $137,000 |
| 2019 | $420 | $162,440 | $27,840 | $134,600 |
| 2018 | $3,406 | $151,080 | $25,520 | $125,560 |
| 2017 | $2,331 | $91,840 | $17,080 | $74,760 |
| 2016 | $2,330 | $91,840 | $17,080 | $74,760 |
| 2015 | $2,667 | $91,840 | $17,080 | $74,760 |
| 2014 | $2,425 | $91,840 | $17,080 | $74,760 |
Source: Public Records
Map
Nearby Homes
- 1530 Rucker Rd
- 116 Emily Ln
- 845 Melbourne Trail
- 890 Melbourne Trail
- 1282 Harris Commons Place Unit 37
- 1614 Rucker Rd
- 555 Spring Gate Ln
- 1413 Bellsmith Dr
- 1370 Bellsmith Dr
- 1386 Bellsmith Dr
- 3052 Steeplechase
- 3058 Steeplechase Unit 4
- 3018 Steeplechase
- 3016 Steeplechase Unit 3
- 11900 Harris Rd
- Rockmart Elite Plan at Emberly - Mariposa Collection
- Rockmart Grand Plan at Emberly - Mariposa Collection
- Rockmart Plan at Emberly - Mariposa Collection
- Hedgewood Plan at Emberly - Monarch Collection
- Hedgewood with Basement Plan at Emberly - Monarch Collection
- 110 Greenmont Downs Trace Unit 1
- 130 Greenmont Downs Trace Unit 1
- 12040 Greenmont Walk
- 0 Greenmont Downs Trace Unit 7551154
- 12030 Greenmont Walk
- 100 Greenmont Downs Trace
- 145 Greenmont Downs Trace
- 135 Greenmont Downs Trace Unit 11
- 125 Greenmont Downs Trace Unit 1
- 12020 Greenmont Walk Unit 1
- 115 Greenmont Downs Trace
- 105 Greenmont Downs Trace
- 140 Greenmont Cir
- 150 Greenmont Cir Unit 1
- 130 Greenmont Cir
- 160 Greenmont Cir
- 12045 Greenmont Walk
- 12080 Greenmont Walk
- 120 Greenmont Cir Unit 1
- 1420 Rucker Rd