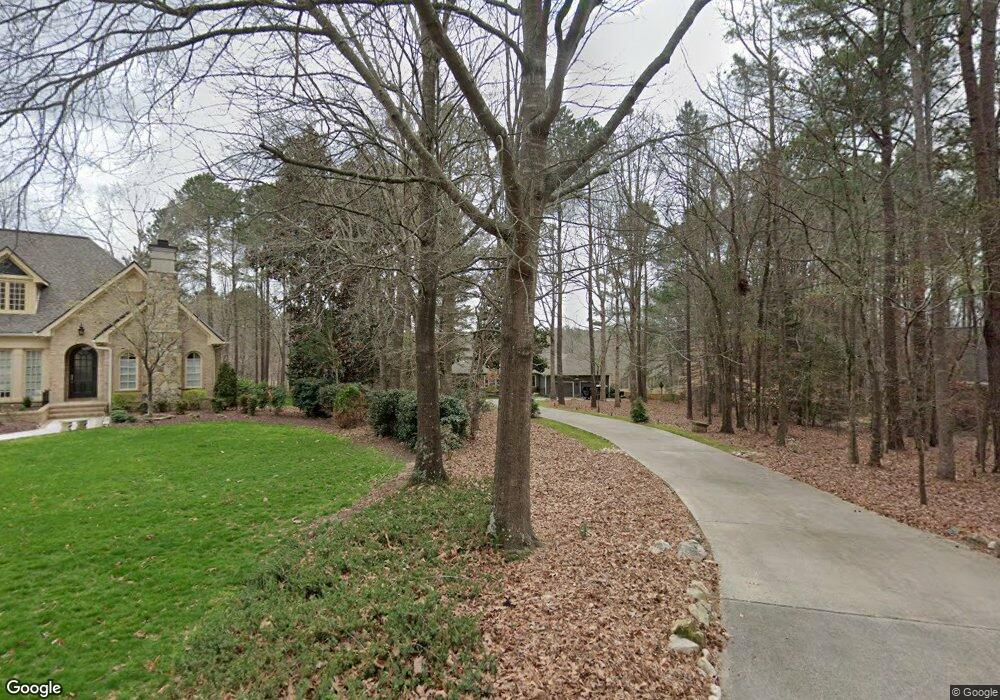
120 Hibiscus Dr Clayton, NC 27527
Estimated Value: $711,333 - $797,000
3
Beds
3
Baths
2,776
Sq Ft
$275/Sq Ft
Est. Value
About This Home
This home is located at 120 Hibiscus Dr, Clayton, NC 27527 and is currently estimated at $763,833, approximately $275 per square foot. 120 Hibiscus Dr is a home located in Johnston County with nearby schools including East Clayton Elementary School, Riverwood Middle School, and Clayton High.
Ownership History
Date
Name
Owned For
Owner Type
Purchase Details
Closed on
Mar 27, 2024
Sold by
Reeves Gwyn Danny and Webb Gwyn Karen
Bought by
Gwyn Family Trust and Gwyn
Current Estimated Value
Purchase Details
Closed on
Dec 19, 2019
Sold by
Futrell Mark A and Futrell Beverly J
Bought by
Gwyn Danny R and Gwyn Karen W
Home Financials for this Owner
Home Financials are based on the most recent Mortgage that was taken out on this home.
Original Mortgage
$457,900
Interest Rate
3.6%
Mortgage Type
New Conventional
Purchase Details
Closed on
Apr 4, 2014
Sold by
Wells Fargo Bank Na
Bought by
Futrell Mark A and Futrell Beverly J
Home Financials for this Owner
Home Financials are based on the most recent Mortgage that was taken out on this home.
Original Mortgage
$309,700
Interest Rate
4.37%
Mortgage Type
VA
Purchase Details
Closed on
Dec 20, 2013
Sold by
Coats Bryan K and Coats Betty J
Bought by
Wells Fargo Bank Na
Purchase Details
Closed on
Jan 5, 2004
Sold by
Coats Bryan Keith
Bought by
Hohmann Kenneth W
Create a Home Valuation Report for This Property
The Home Valuation Report is an in-depth analysis detailing your home's value as well as a comparison with similar homes in the area
Home Values in the Area
Average Home Value in this Area
Purchase History
| Date | Buyer | Sale Price | Title Company |
|---|---|---|---|
| Gwyn Family Trust | -- | None Listed On Document | |
| Gwyn Danny R | $482,000 | None Available | |
| Futrell Mark A | $300,000 | None Available | |
| Wells Fargo Bank Na | $271,481 | None Available | |
| Hohmann Kenneth W | $380,000 | -- |
Source: Public Records
Mortgage History
| Date | Status | Borrower | Loan Amount |
|---|---|---|---|
| Previous Owner | Gwyn Danny R | $457,900 | |
| Previous Owner | Futrell Mark A | $309,700 |
Source: Public Records
Tax History Compared to Growth
Tax History
| Year | Tax Paid | Tax Assessment Tax Assessment Total Assessment is a certain percentage of the fair market value that is determined by local assessors to be the total taxable value of land and additions on the property. | Land | Improvement |
|---|---|---|---|---|
| 2025 | $4,640 | $730,660 | $134,330 | $596,330 |
| 2024 | $3,891 | $480,320 | $73,950 | $406,370 |
| 2023 | $3,891 | $480,320 | $73,950 | $406,370 |
| 2022 | $3,939 | $480,320 | $73,950 | $406,370 |
| 2021 | $3,939 | $480,320 | $73,950 | $406,370 |
| 2020 | $4,083 | $480,320 | $73,950 | $406,370 |
| 2019 | $3,778 | $444,460 | $73,950 | $370,510 |
| 2018 | $3,686 | $423,620 | $73,950 | $349,670 |
| 2017 | $3,601 | $423,620 | $73,950 | $349,670 |
| 2016 | $3,601 | $423,620 | $73,950 | $349,670 |
| 2015 | $3,601 | $423,620 | $73,950 | $349,670 |
| 2014 | $3,601 | $423,620 | $73,950 | $349,670 |
Source: Public Records
Map
Nearby Homes
- 3305 Wisteria Dr
- 117 Lake Point Dr
- 165 Neuse River Pkwy
- 23 Lafoy Dr
- 153 Wrenwood Dr
- 432 Wrenwood Dr
- 128 Waterleaf Place
- 349 E Porthaven Way
- 2000 Mountain Laurel Dr
- 152 Antler Steel Dr
- 47 Whitley Ridge Dr
- 116 Townsend Dr
- 902 Birkdale Dr
- 143 Lily Crossing
- 0 Brookhaven Dr
- 205 Townsend Dr
- 170 River Hills Dr
- 104 Avenel Ln
- 65 Sundew Ct
- 125 River Hills Dr
- 117 Hibiscus Dr
- 3518 Queen Ann Dr
- 3516 Queen Ann Dr
- 118 Jasmine Dr
- 3520 Queen Ann Dr
- 112 Hibiscus Dr
- 113 Hibiscus Dr
- 120 Jasmine Dr
- 120 Jasmine Dr Unit 61
- 3519 Queen Ann Dr
- 119 Jasmine Dr
- 116 Jasmine Dr
- 3517 Queen Ann Dr
- 3512 Queen Ann Dr
- 3515 Queen Ann Dr
- 109 Hibiscus Dr
- 112 Jasmine Dr
- 108 Hibiscus Dr
- 121 Jasmine Dr
- 3508 Queen Ann Dr